Physical Address
304 North Cardinal St.
Dorchester Center, MA 02124
On completion of this chapter, you should be able to:
Explain the transducer selection and patient position for a cardiac examination
Describe the imaging planes used in echocardiography
Define suprasternal, subcostal, apical , and parasternal
Describe a normal cardiac examination using two-dimensional, color flow, Doppler, and M-mode imaging modes
List and discuss the applications of color flow Doppler in the echocardiographic examination
The widespread clinical acceptance of echocardiography has tremendously aided the diagnostic results of the cardiac examination. Improved transducer design, resolution capabilities, focus parameters, gray-scale differentiation, gain control factors, cine loop functions, and other software capabilities have enabled the cardiac sonographer to record consistent, high-quality images from the multiple scan planes necessary to obtain a dynamic composite image of the cardiac structures. Color flow Doppler allows the cardiac sonographer to obtain additional velocity information in detecting intracardiac shunt flow, mapping regurgitant jets, and determining obstructive flow pathways.
The evaluation of cardiac structures by echocardiography is regarded as an essential diagnostic tool in clinical cardiology. The reason for its widespread use in the evaluation of cardiac disease is its noninvasive, reproducible, and accurate assessment of cardiac structures. Echocardiography further exploded when three- or four-dimensional (3D/4D) echocardiography was developed, which allowed the cardiac structures to be anatomically and dynamically visualized in real-time. Thus the echocardiographer can assess the four chambers of the heart, the cardiac valves, the intracardiac anatomy, and the intracardiac lesions; observe contractility; determine valvular function; and assess hemodynamics. The combination of 2D/3D/4D, Doppler, tissue Doppler imaging, strain, and color flow mapping provides an extremely accurate means to evaluate wall or valve thickness, valvular orifice and chamber size, and contractility of the cardiac structures. Transesophageal echocardiography and 3D echocardiography has enabled exquisite visualization of the heart while the transducer is guided through the mouth and into the esophagus to closely image the cardiac anatomy and guide intracardiac interventional procedures.
Contrast injected through an intravenous line into the bloodstream has provided an additional pathway to enhance cardiac endocardial borders and clearly demonstrate cardiac thrombus and mass lesions. Saline bubble injections have been a clinical aid to determine the presence and direction of interatrial septal shunt flow.
Exercise stress echocardiography, supine bike stress echocardiography, and dobutamine stress echocardiography have provided additional information about the contractility, hemodynamics, and performance of the left ventricle in a simulated stress situation.
To perform an echocardiographic examination of good diagnostic quality, the sonographer must understand the anatomic, hemodynamic, and pathophysiologic parameters of the heart and be able to incorporate the physical principles of sonography into the routine examination. This chapter introduces the reader to the basic technical components of echocardiography through 2D, M-mode, Doppler, and color Doppler imaging. Emphasis will be on common findings the general sonographer may encounter “above the diaphragm” in the subsequent Clinical Echocardiography chapters.
Most echocardiographic examinations are performed with the sonographer’s left hand. The ultrasound equipment is placed on the right side of the echo bed by the head of the patient. The ergonomic echo chair and echo bed ( Fig. 32.1 ) are essential to avoid future musculoskeletal problems. The echo bed should have at least a thick 3-inch cushion, a large drop-down component for the apical views, a backrest to support the patient when lying in a decubitus position, and adequate space for the patient’s shoulder and head. The bed should be able to raise and lower to allow the sonographer to be on the same plane as the patient, as the sonographer may rest their elbow on the echo bed when performing the parasternal views.
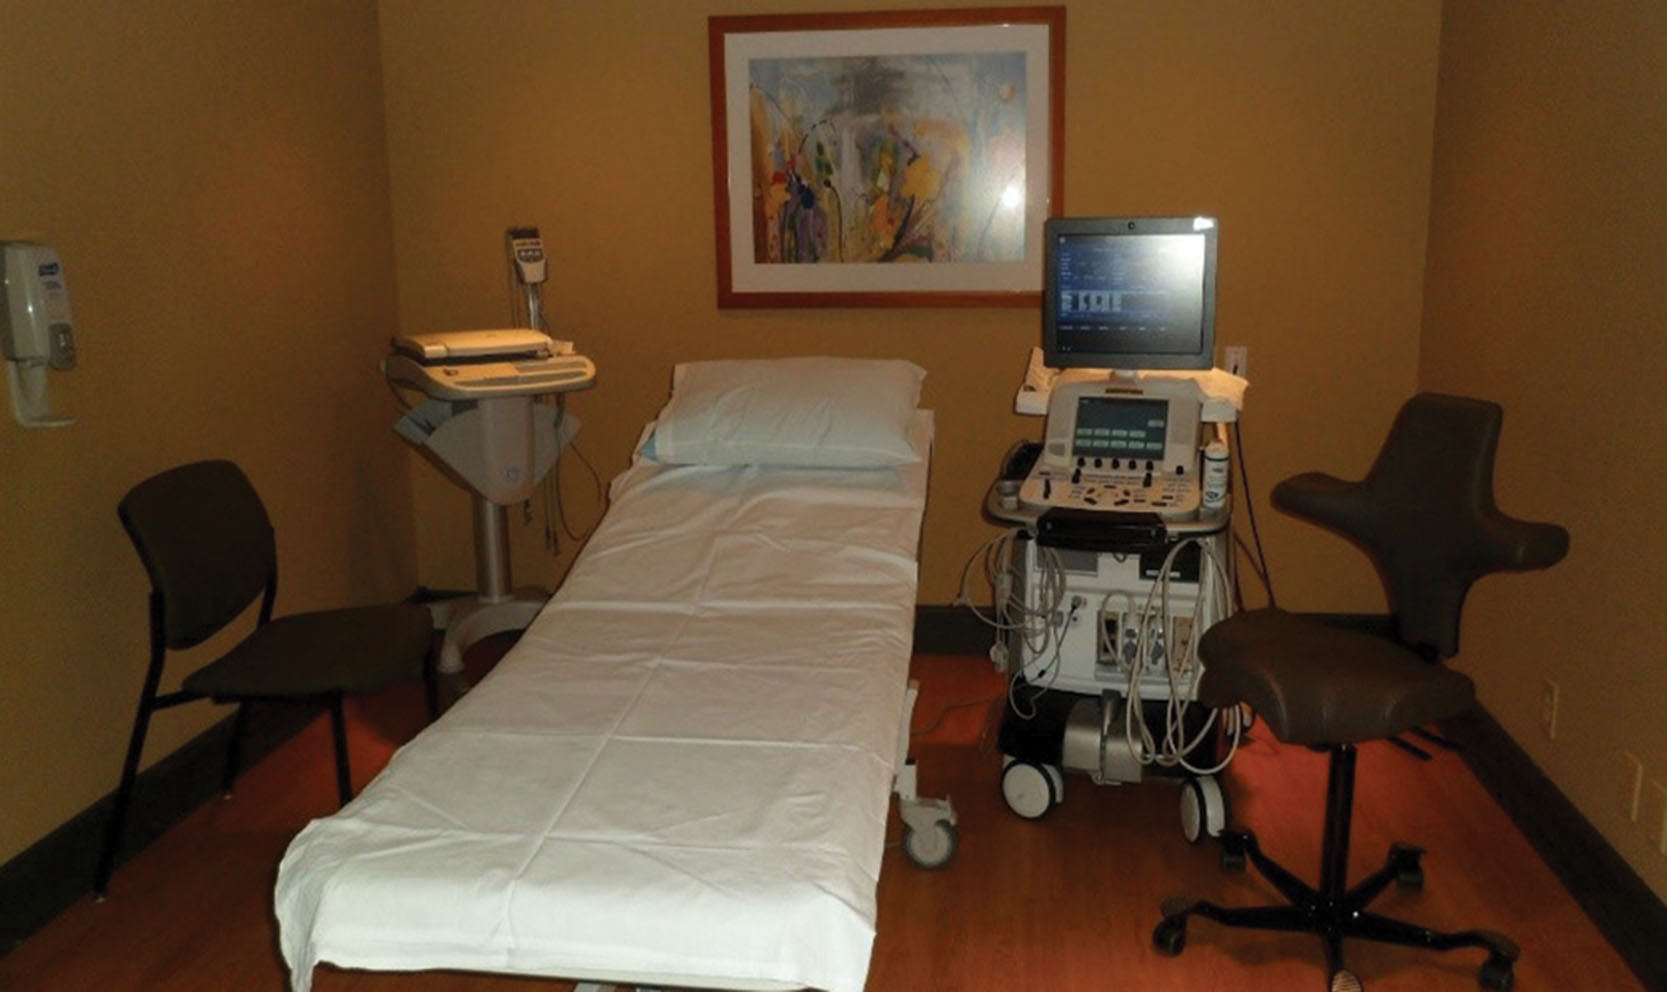
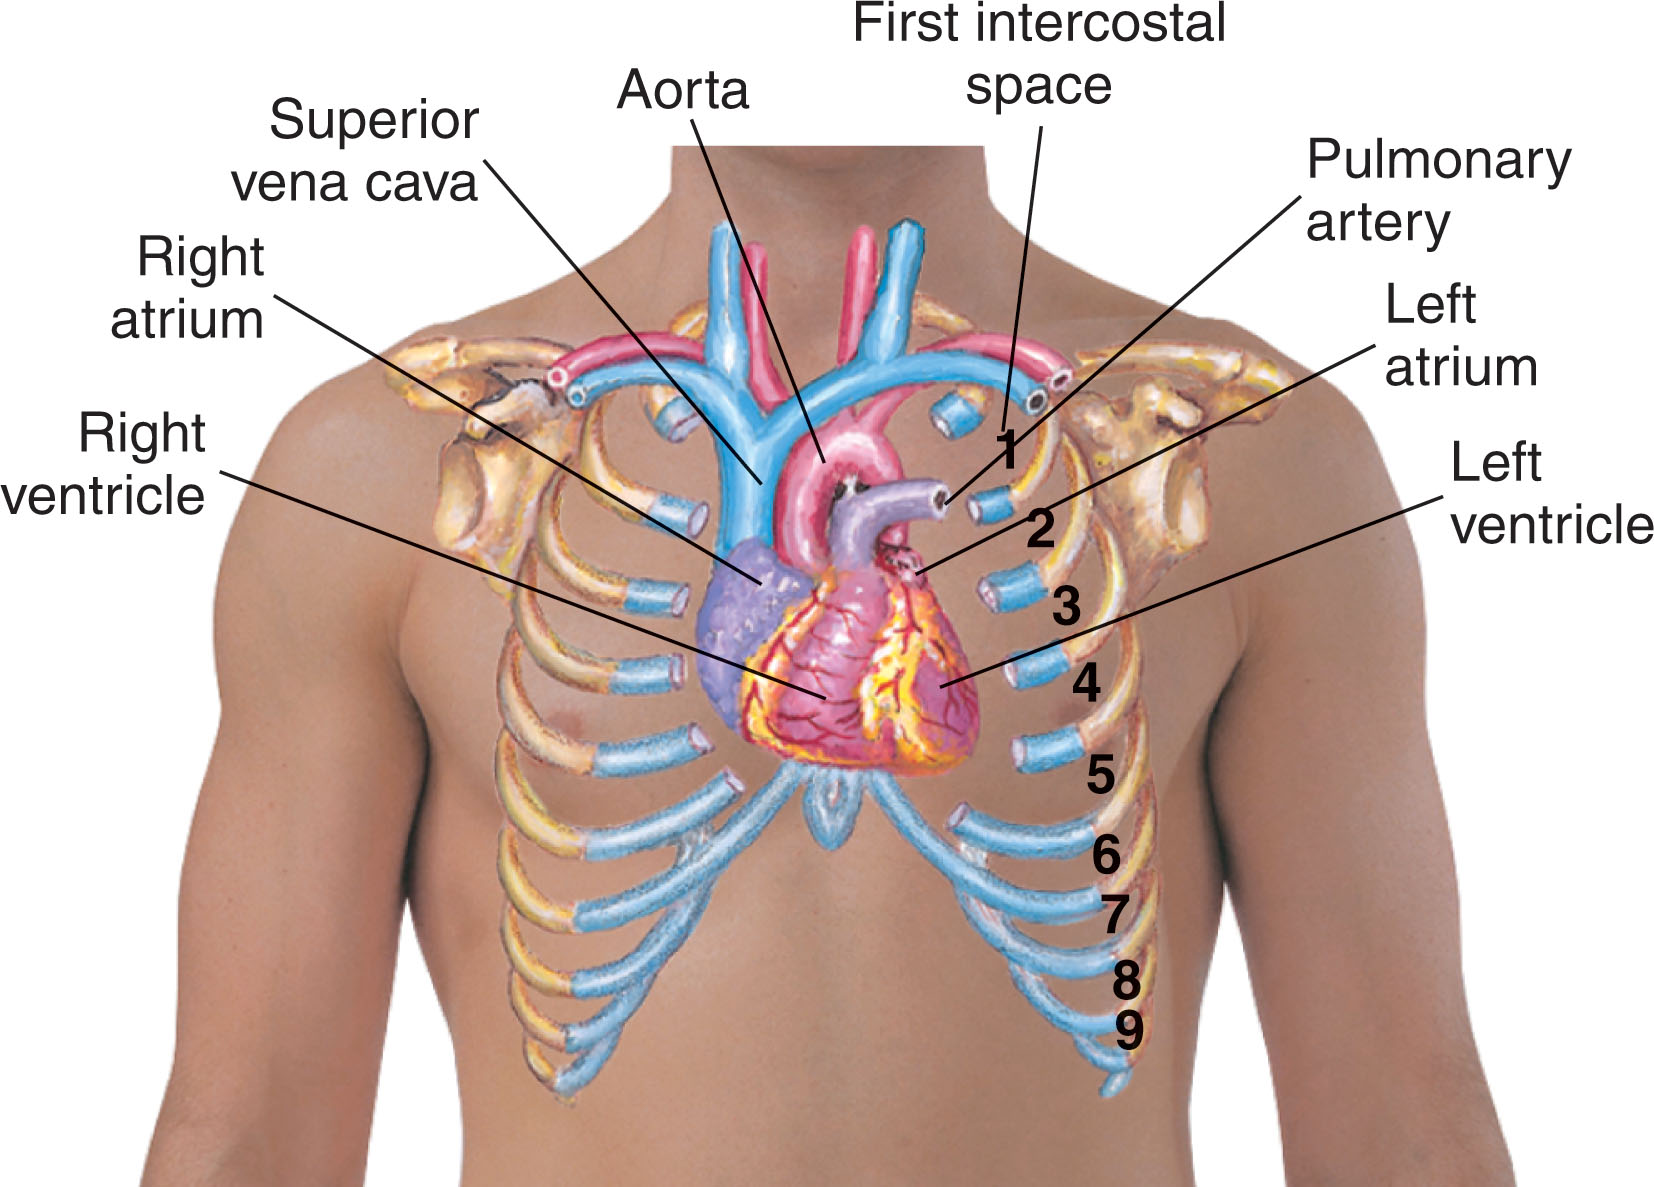
The patient is examined while in the left lateral decubitus position. This position allows the heart to move away from the sternum and closer to the chest wall, thus allowing a better cardiac window. The cardiac window may be considered the area on the anterior chest where the heart is just beneath the skin surface and free of lung interference; it is usually found between the third and fifth intercostal spaces, slightly to the left of the sternal border.
The cardiac sonographer must keep in mind that different body shapes require variations in transducer position. An obese patient may have a horizontal transverse heart, and thus a slight lateral movement from the sternal border may be needed to record cardiac structures ( Fig. 32.2 ). A thin patient may have a long and slender heart, requiring a lower, more medial transducer position. Barrel-chested patients may have echocardiographic difficulties because of the lung absorption interference, and it may be necessary to turn these patients completely on their left side. Sometimes in these patients, the upright or slightly forward-bent position is useful in forcing the heart closer to the anterior chest wall.
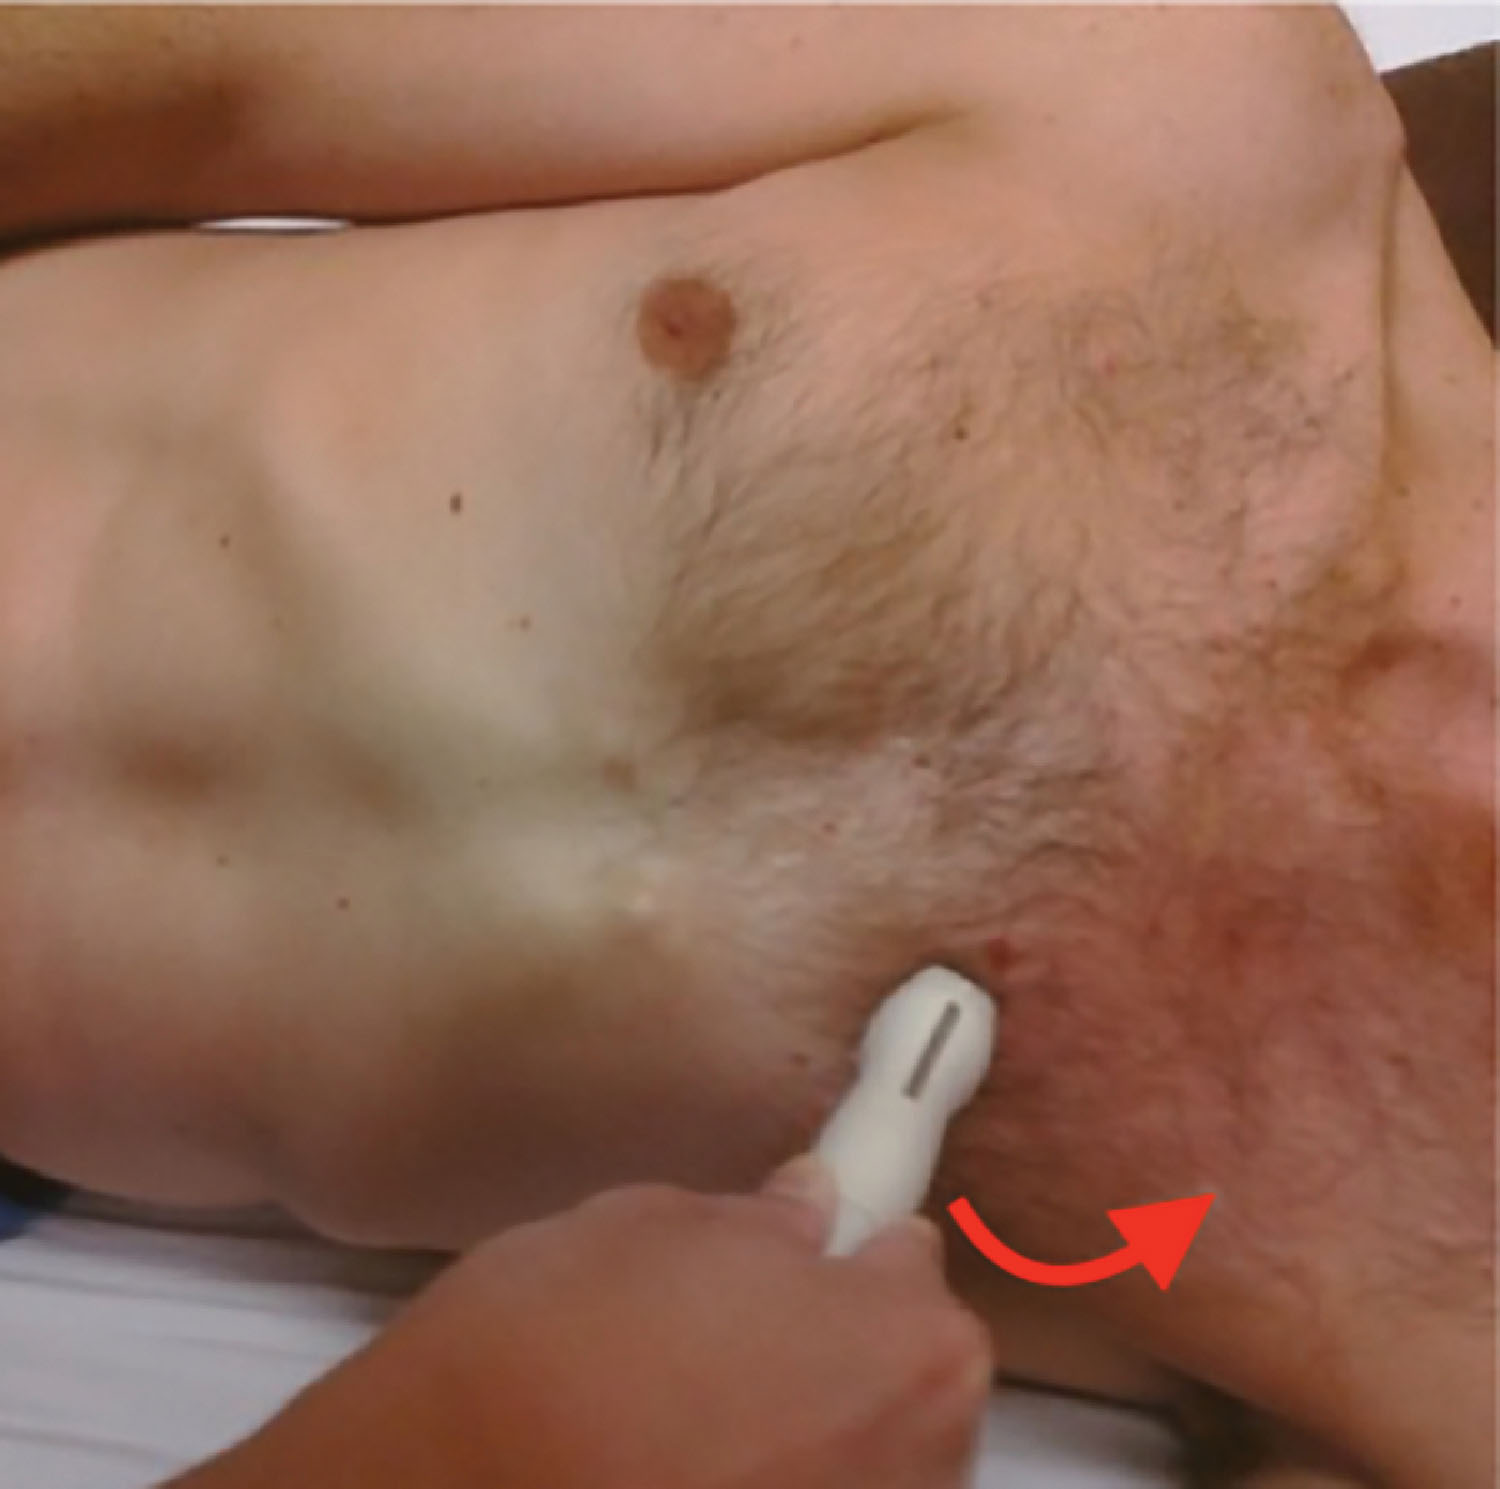
The following techniques are beginning guidelines for the echocardiographic evaluation of the average patient. In the initial echocardiographic study, the sonographer should hold the transducer in their left hand with their fingers near the base of the probe. The notch should be upright for the parasternal long-axis view with slight rotation directed from the right shoulder to the left hip ( Fig. 32.3 ). The sonographer should slowly move the transducer freely along the mid–left sternal border until all the cardiac structures are easily identified is a better practice than restricting the transducer to one interspace. Stay as close to the sternal border as possible; if cardiac pulsations are not imaged, move slightly lateral, but angle the base of the probe medial towards the sternum to see the cardiac structures. This procedure saves time and gives the examiner a better understanding of cardiac relationships. If the heart is actually medial, the best study is performed with the patient completely on his or her left side. Observing the patient’s respiratory pattern may help the sonographer identify if the lungs overshadow the cardiac structures. Controlled breathing will help to obtain good-quality images. If the lung interference clouds the cardiac structures, the patient should breathe in and then exhale for as long as possible to move the lungs away from the field of view. This usually gives the examiner adequate time to record valid information.
Several types of transducers are available for echocardiographic techniques. Most adult cardiac sonographers use multifocal transducers that range from 1.5 to 4.5 MHz with either a manually controlled or an automatic focus. A pediatric patient generally requires a multifocal higher-frequency transducer for improved resolution and near-field definition.
The Committee on Nomenclature and Standards in Two-Dimensional Echo-cardiography of the American Society of Echocardiography recommends the following nomenclature and image orientation standards for transducer locations ( Fig. 32.4 ):
Suprasternal: Patient is supine; transducer placed in the suprasternal notch.
Subcostal: Patient is supine; transducer located near the body midline and beneath the costal margin.
Apical: Patient is in left lateral decubitus position; transducer located over the cardiac apex (at the point of maximal impulse).
Parasternal: Patient is in left lateral decubitus position; transducer placed over the area bounded superiorly by the left clavicle, medially by the sternum, and inferiorly by the apical region.
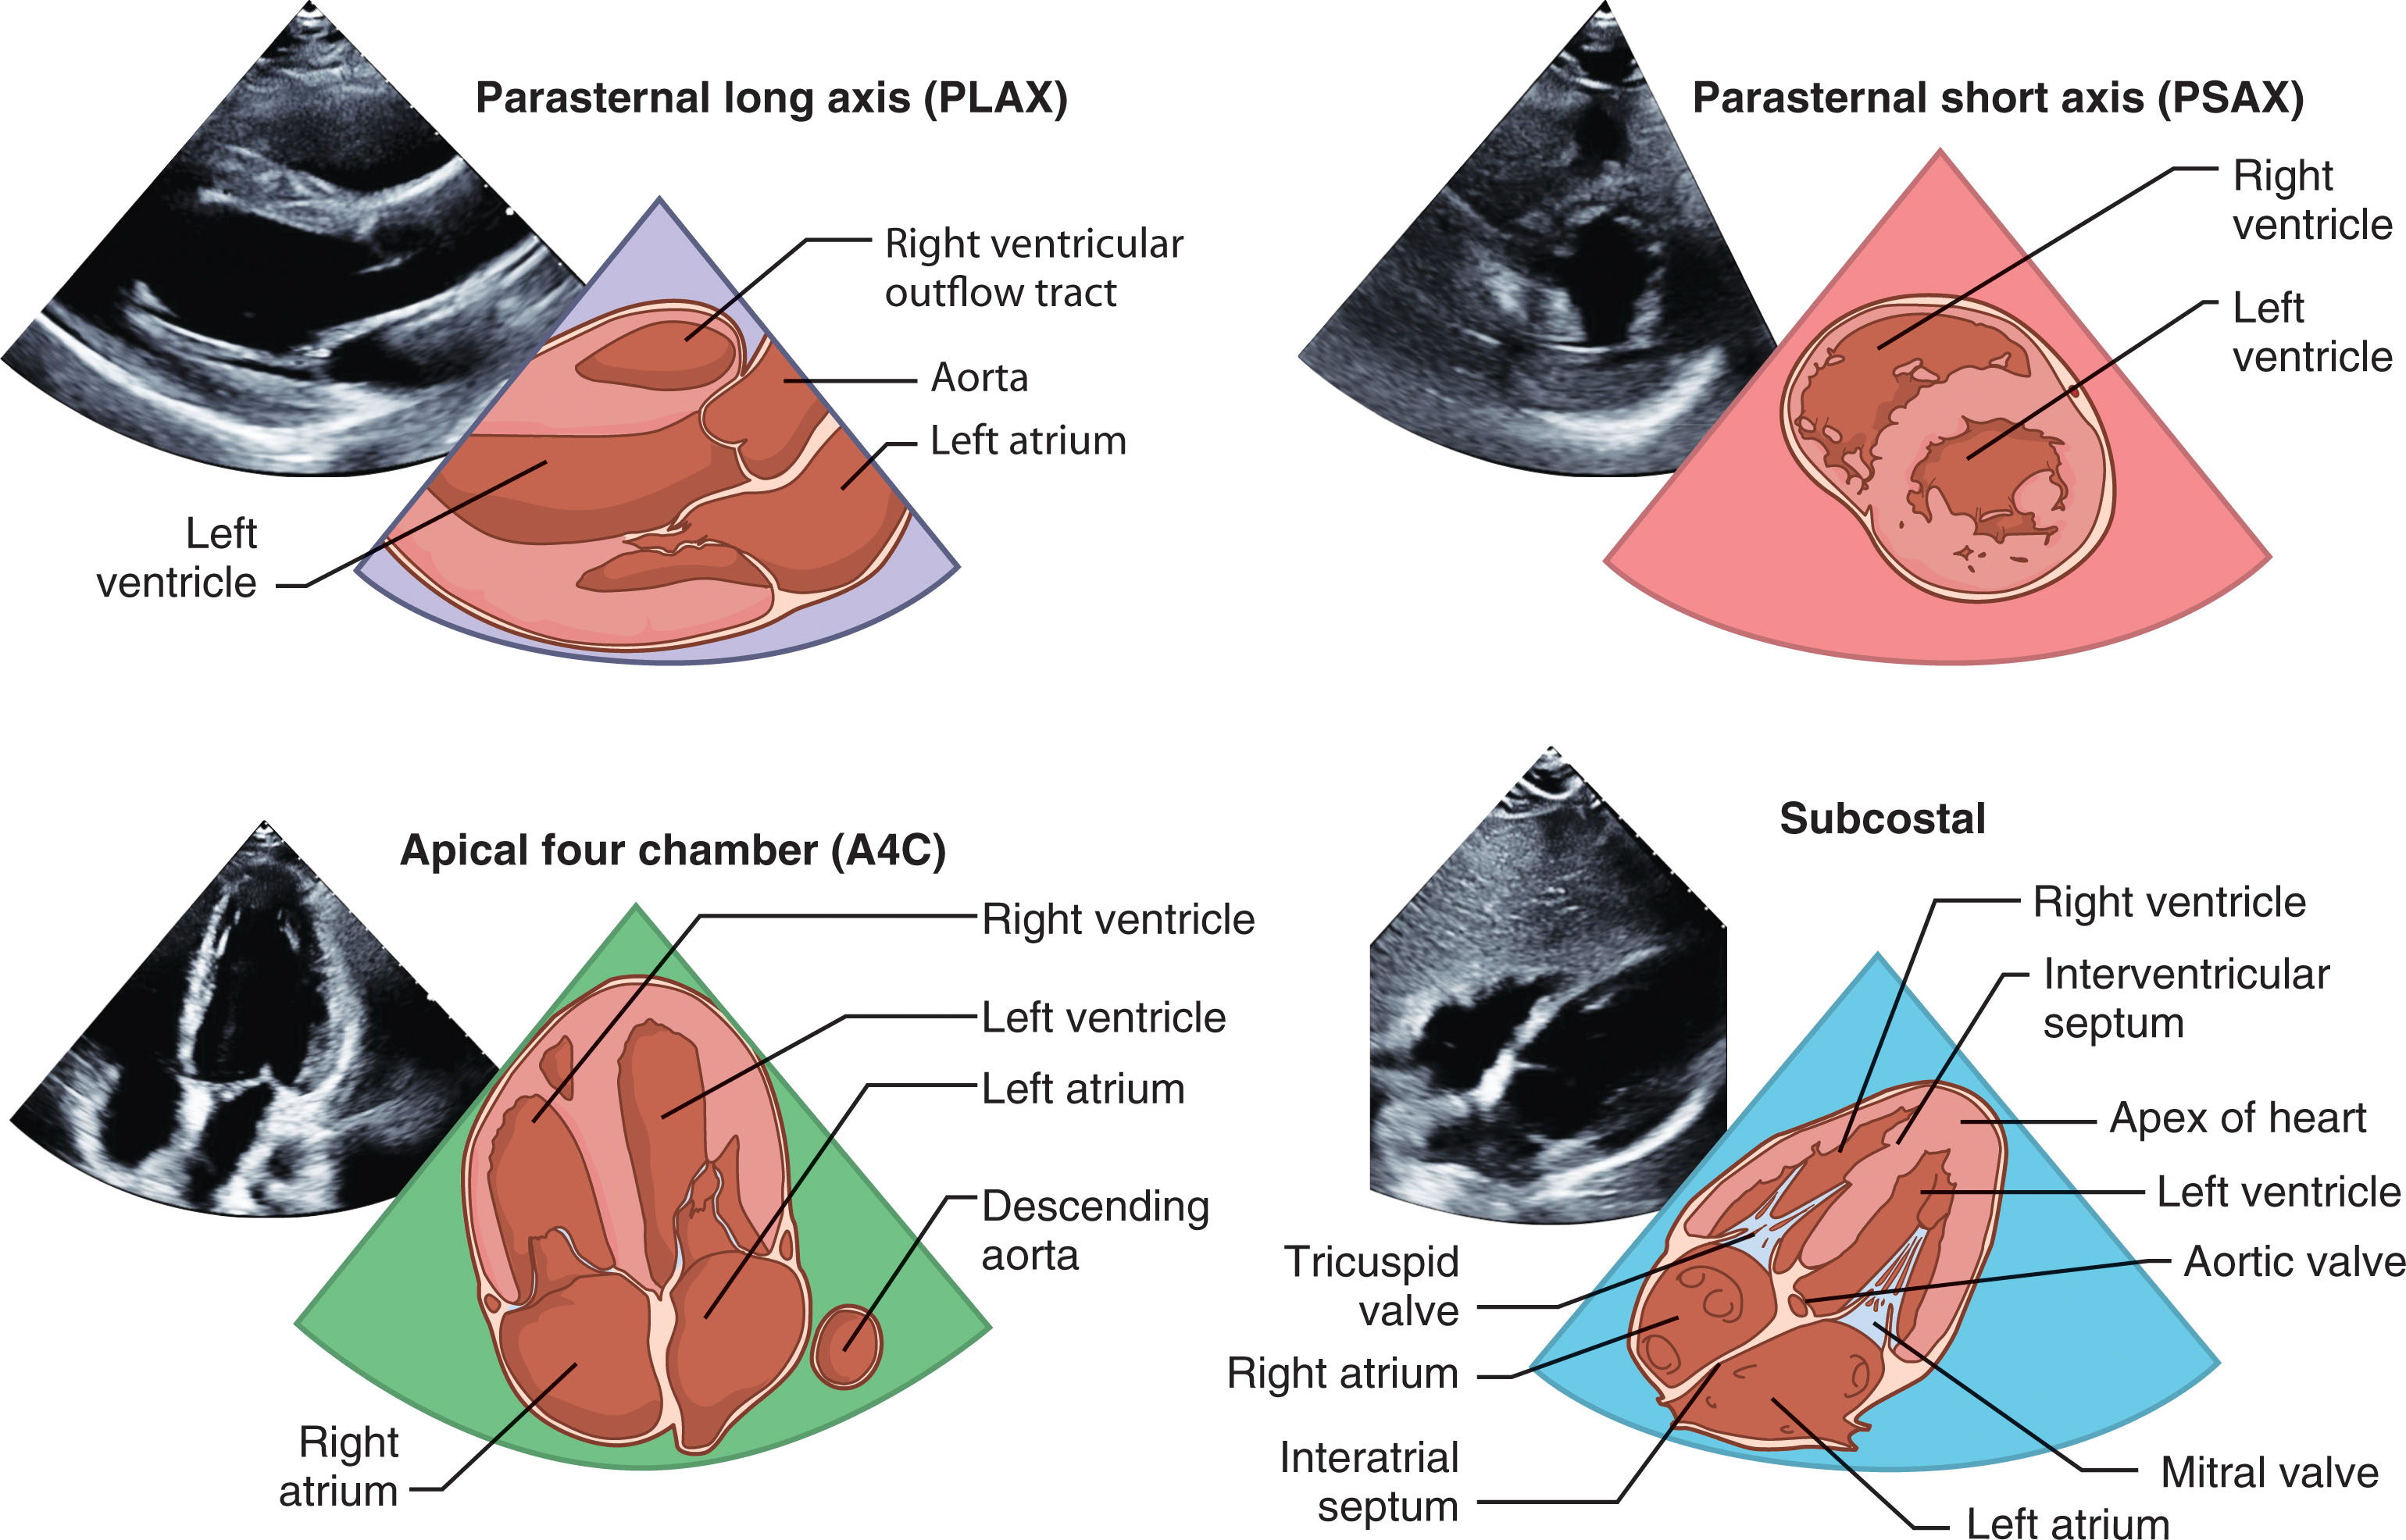
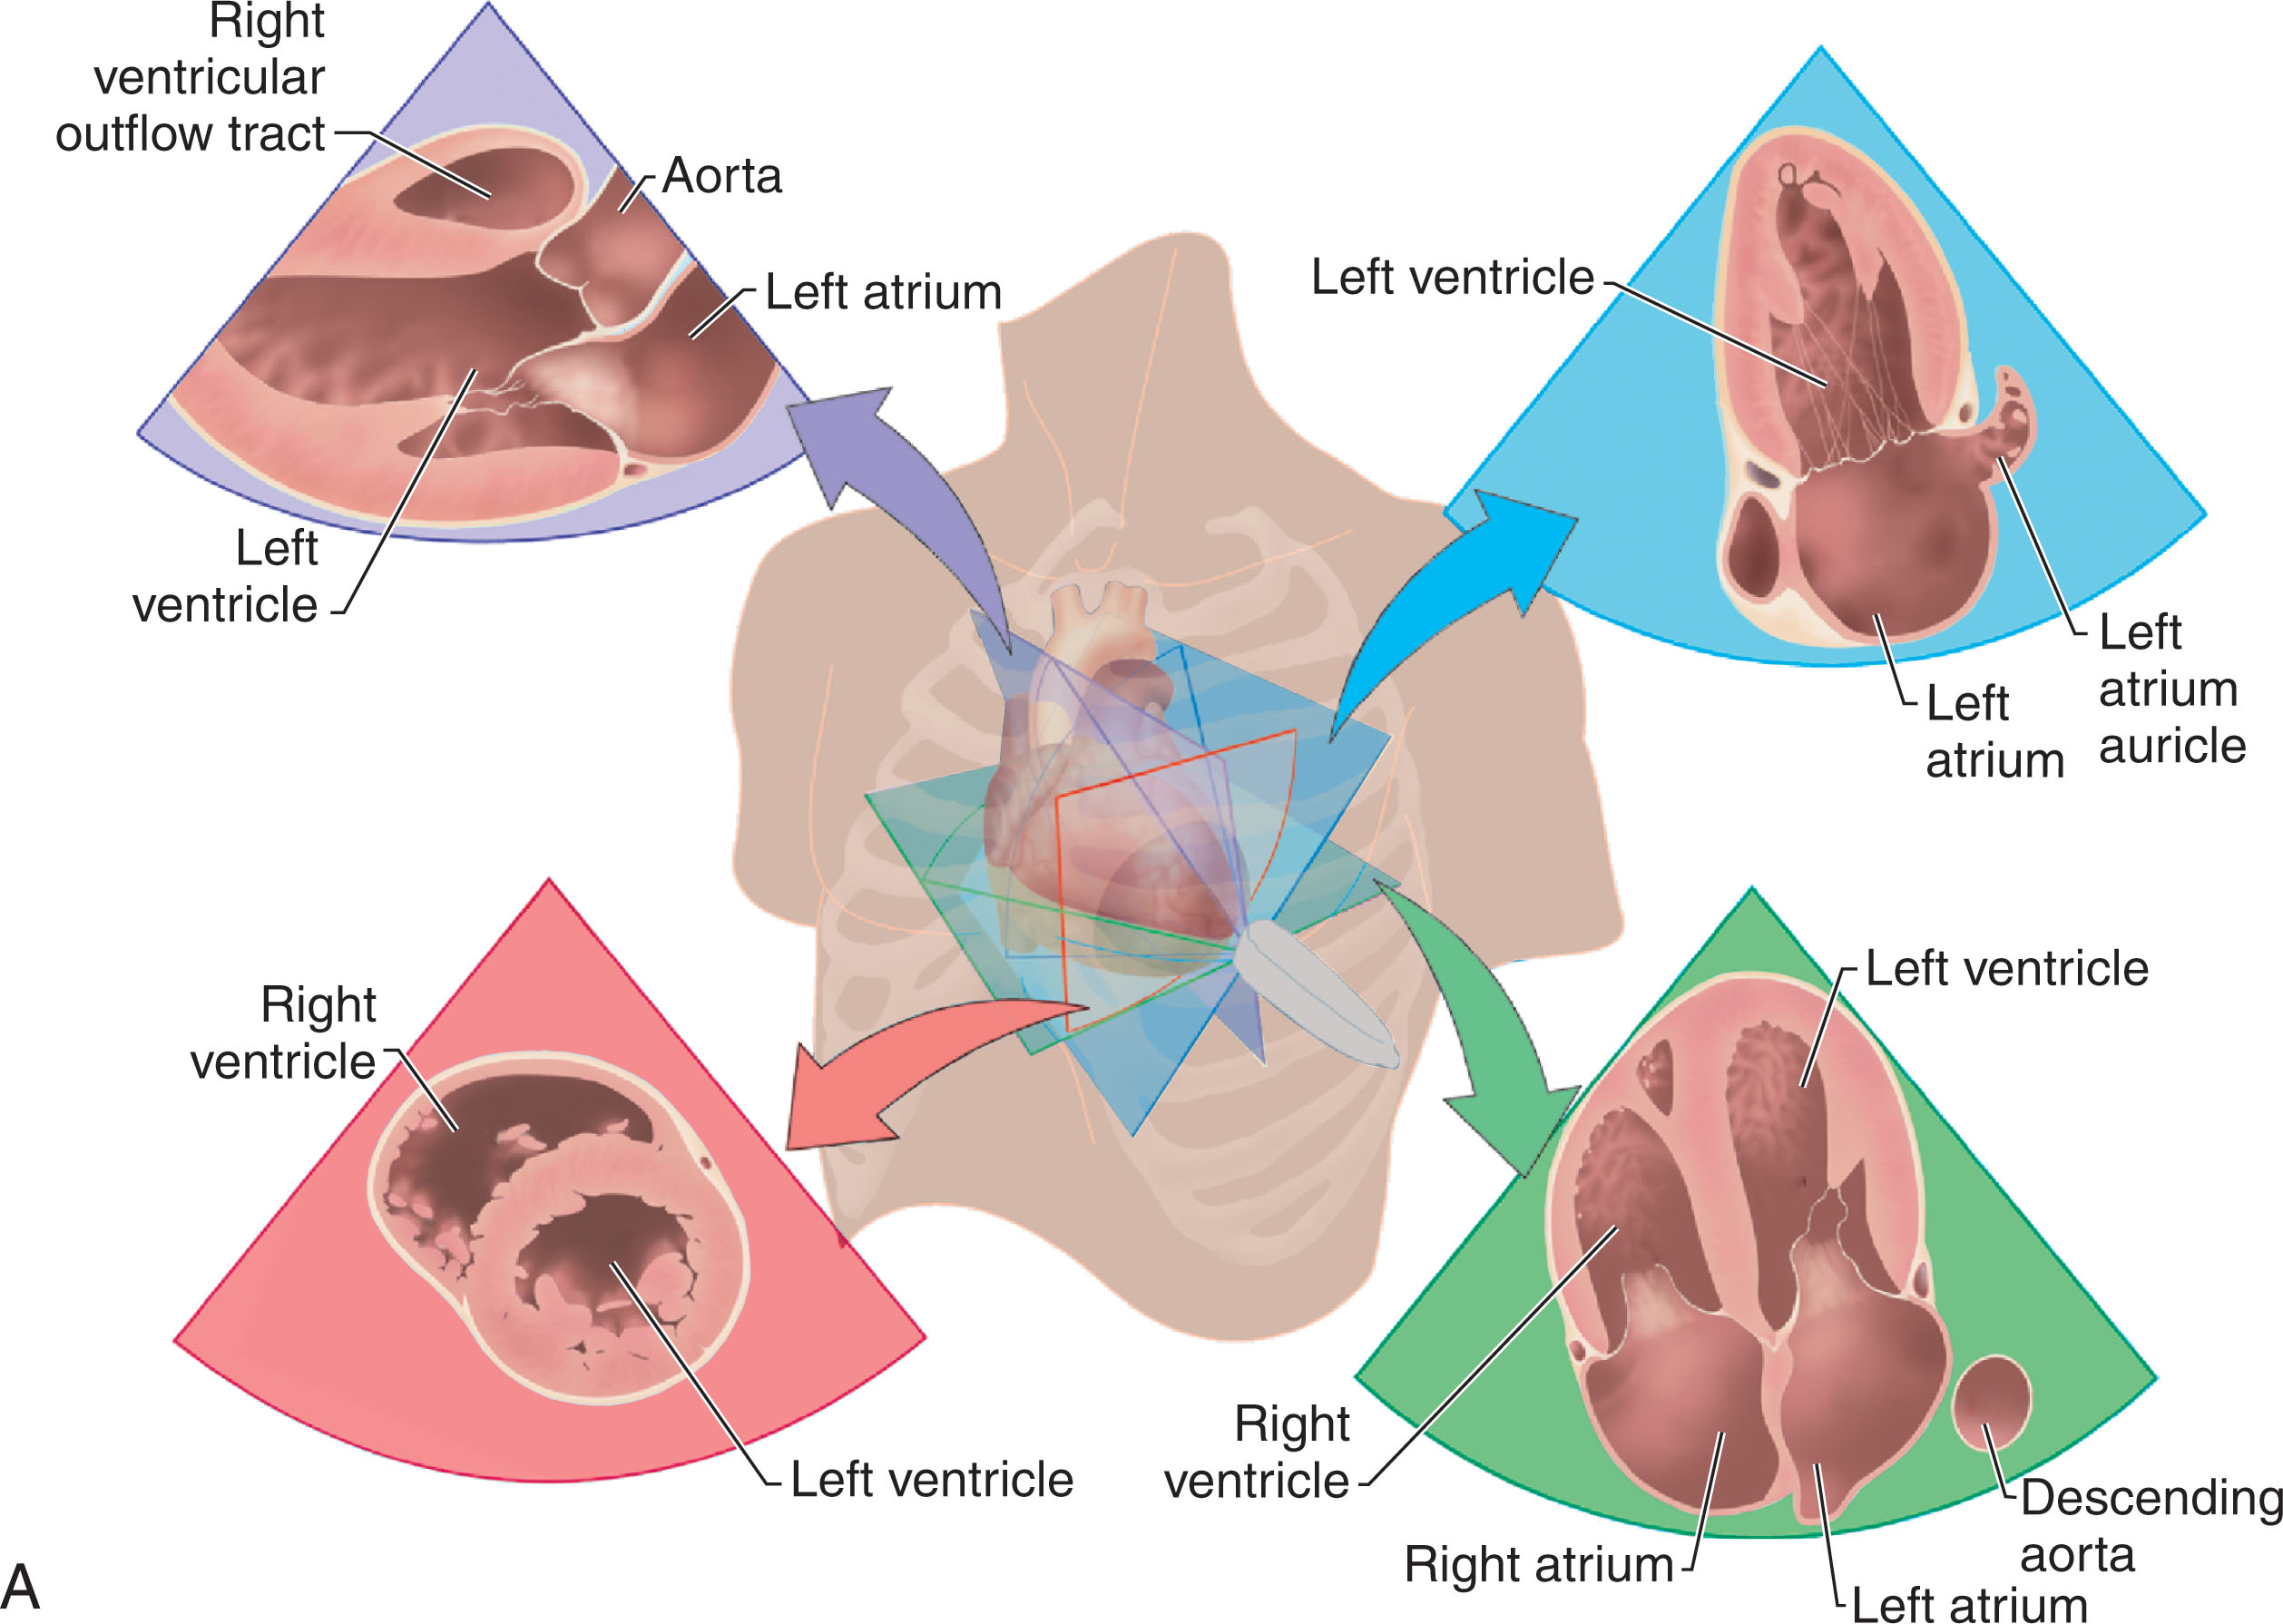
The imaging planes are described by the manner in which the 2D transducer transects the heart:
PLAX (parasternal long axis): Transects the heart perpendicular to the dorsal and ventral surfaces of the body and parallel with the long axis of the heart ( Fig. 32.5 ).
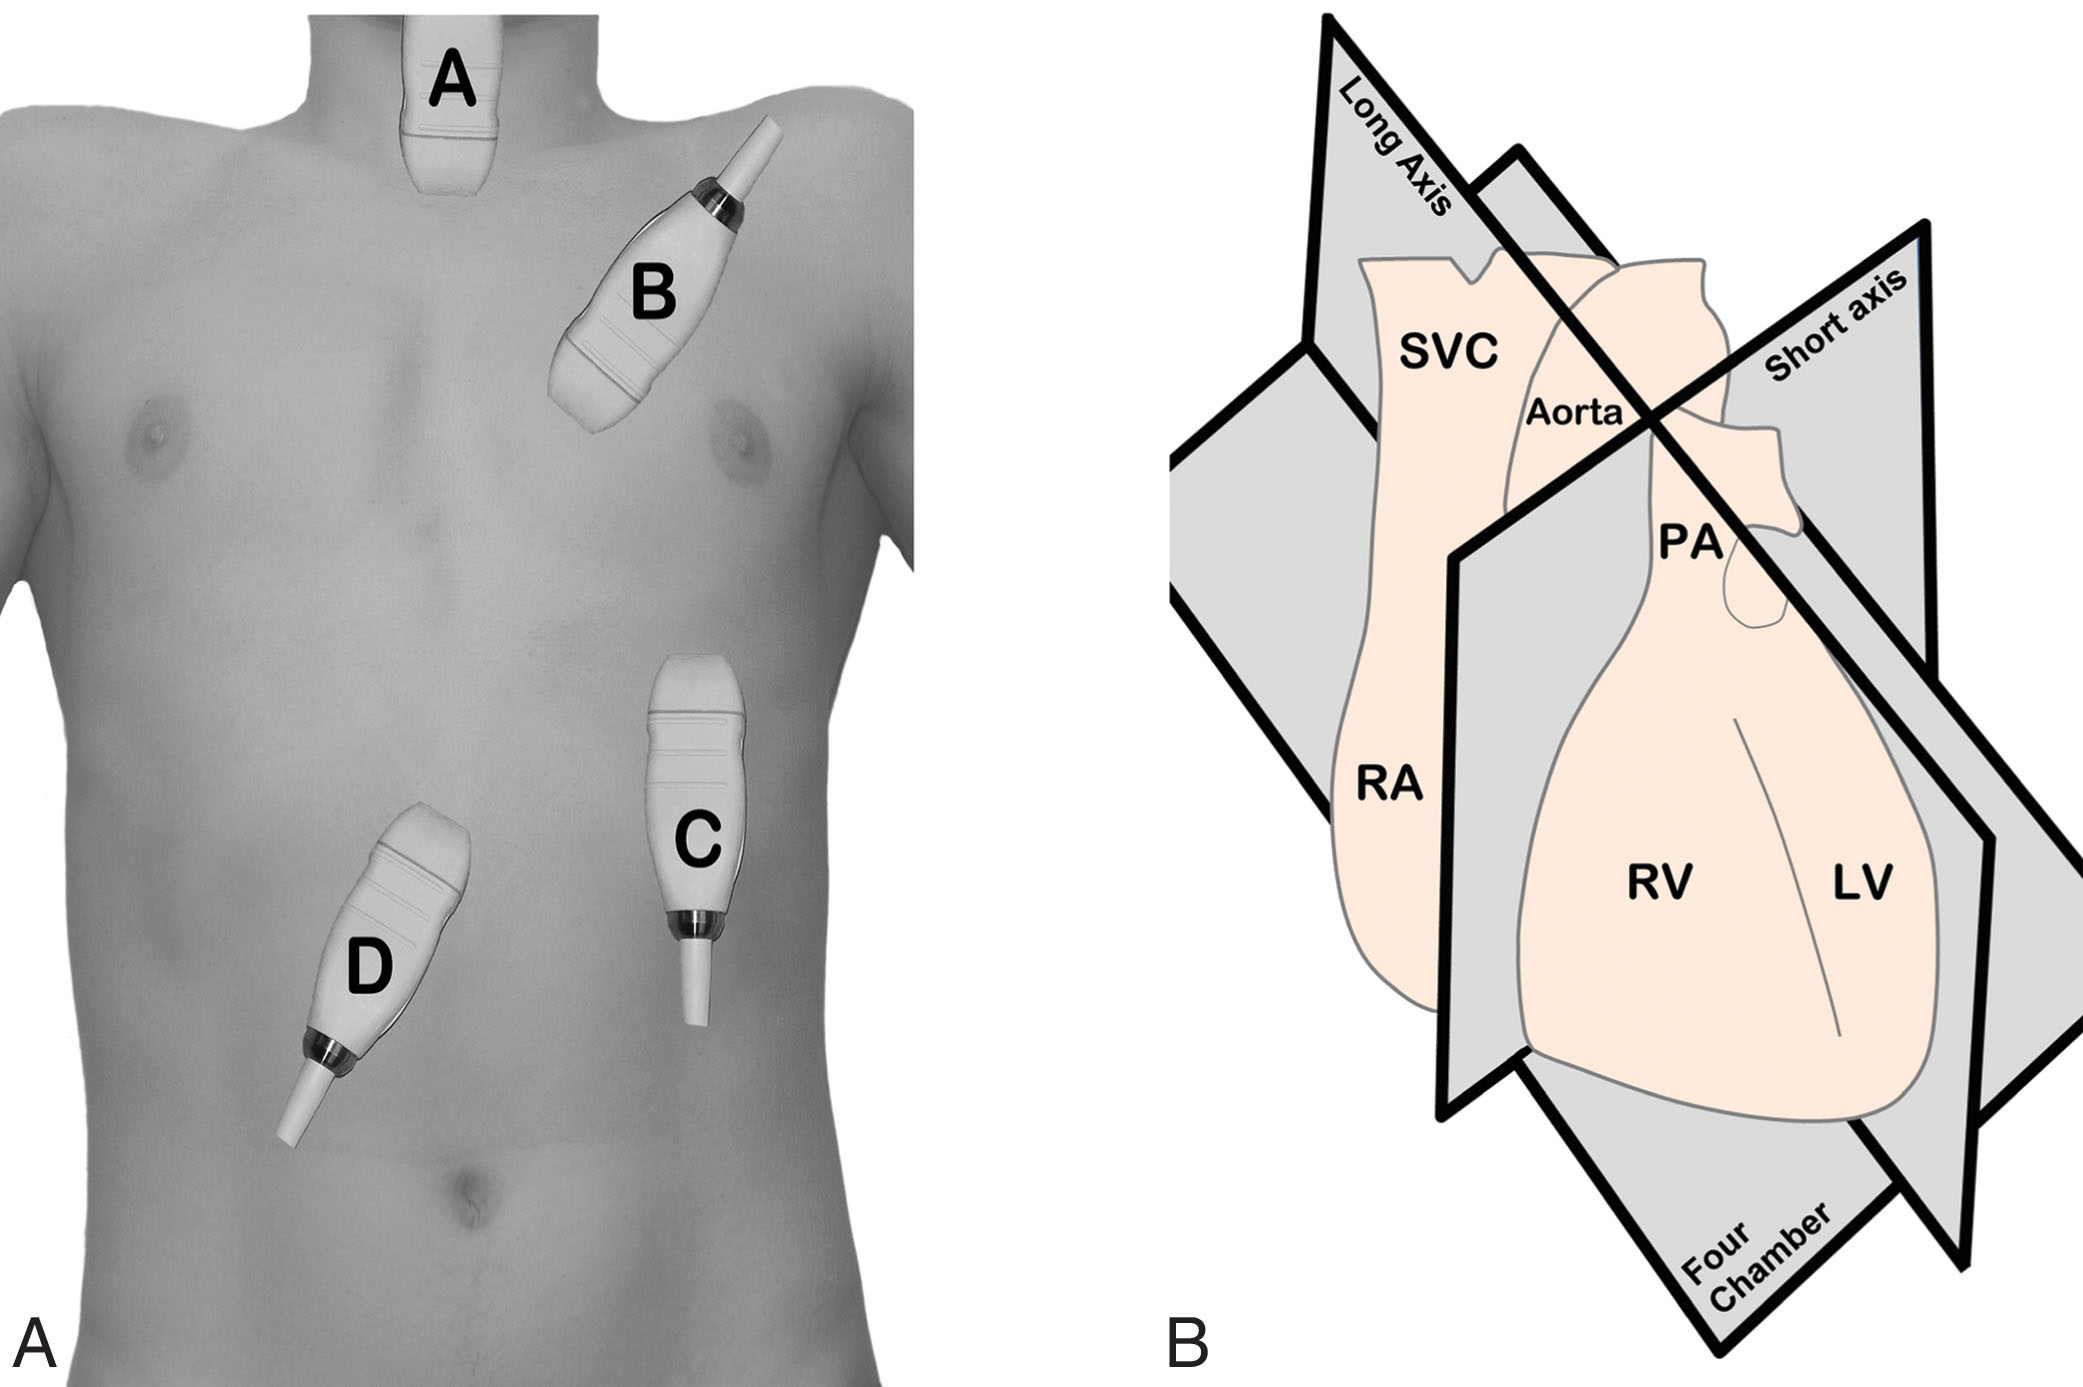
PSAX (parasternal short axis): Transects the heart perpendicular to the dorsal and ventral surfaces of the body and perpendicular to the long axis of the heart (see Fig. 32.5 ).
APICAL four chamber: Transects the heart approximately parallel with the dorsal and ventral surfaces of the body ( Fig. 32.6 ).
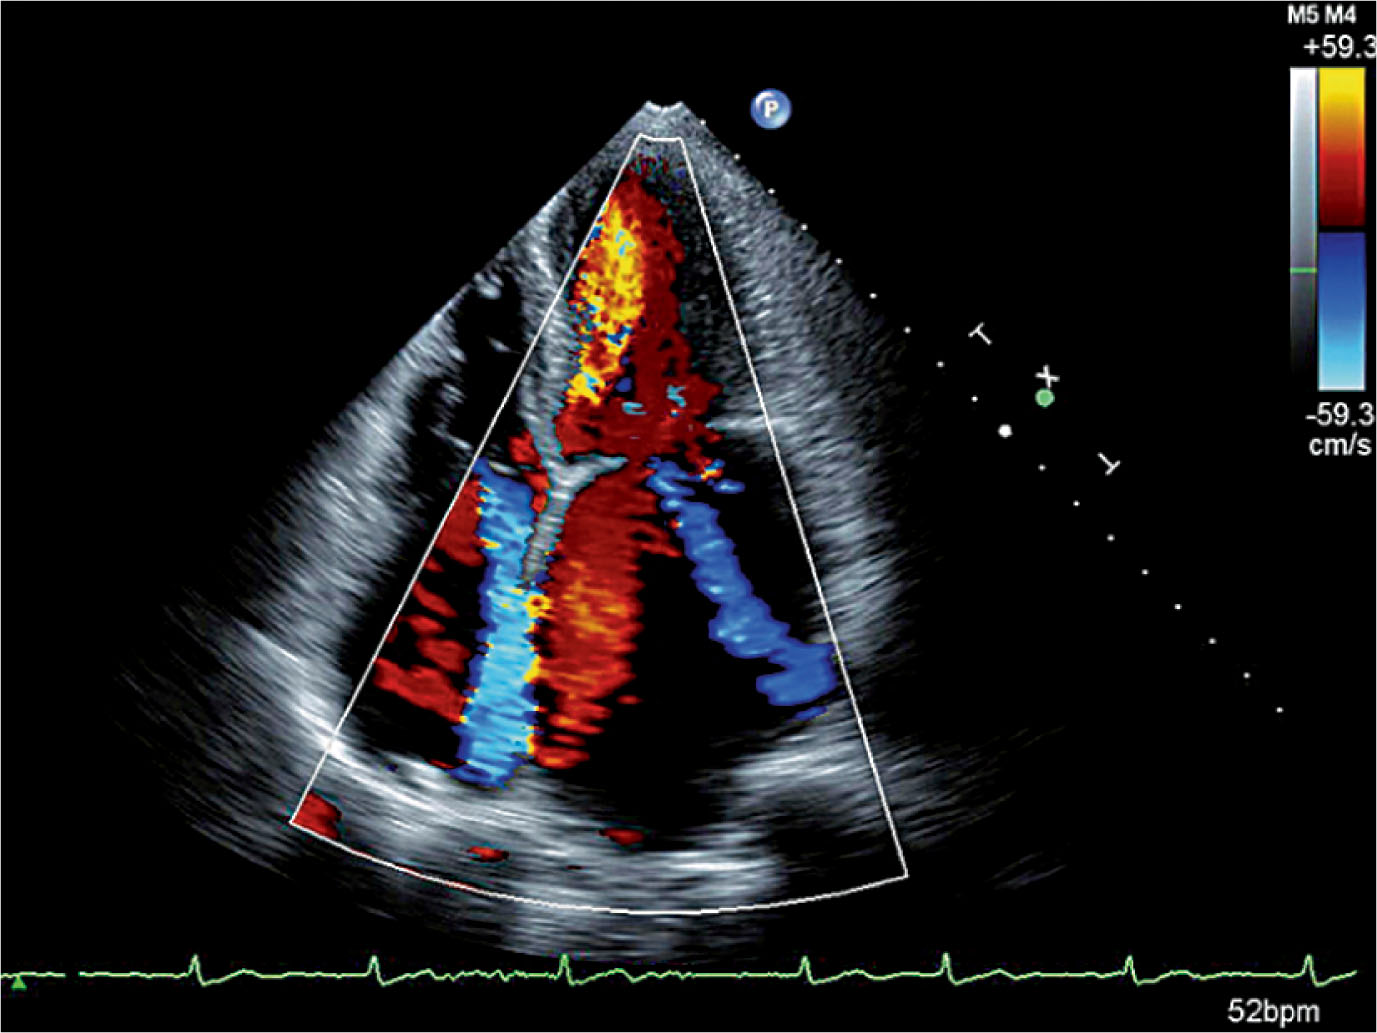
The color flow mapping (CFM) examination is generally performed along with the conventional 2D examination. The advantage of CFM is its ability to rapidly investigate flow direction and movement within the cardiac chambers ( Box 32.1 ). Flow toward the transducer is recorded in red, and flow away from the transducer is blue ( Fig. 32.7 ). This is denoted on the color bar on the right upper side of the image. As the velocities increase, the flow pattern in the variance mode turns from red to various shades of red, orange, and yellow before it aliases. Likewise, flow away from the transducer is recorded in blue; this color turns to various shades of blue, turquoise, and green before it aliases. Depending on the location of the transducer, the flow signals from various structures within the heart appear as different colors. An understanding of cardiac hemodynamics helps the examiner understand the flow patterns.
The color flow mapping examination is generally performed in the same planes used for conventional Doppler examination.
Parasternal long-axis view: MV, TV, AO
Parasternal short-axis view: AO, PA, RVOT, IAS, TV
Parasternal short-axis view: MV, TV, AO, PV
Apical four-chamber plane: MV, TV
Apical five-chamber plane: LVOT, AV
Apical long-axis, two-chamber view: LV, MV, LA
Subcostal four-chamber view: IAS, IVS, RV, LV, RA, LA
Subcostal view: IVC, hepatic veins
Subcostal five-chamber view: AO, LVOT
Subcostal short-axis view: AO, PA, RVOT
Suprasternal view (long axis): ascending and descending aorta, SVC
Suprasternal view (short axis): arch, RPA, LA, SVC, pulmonary veins
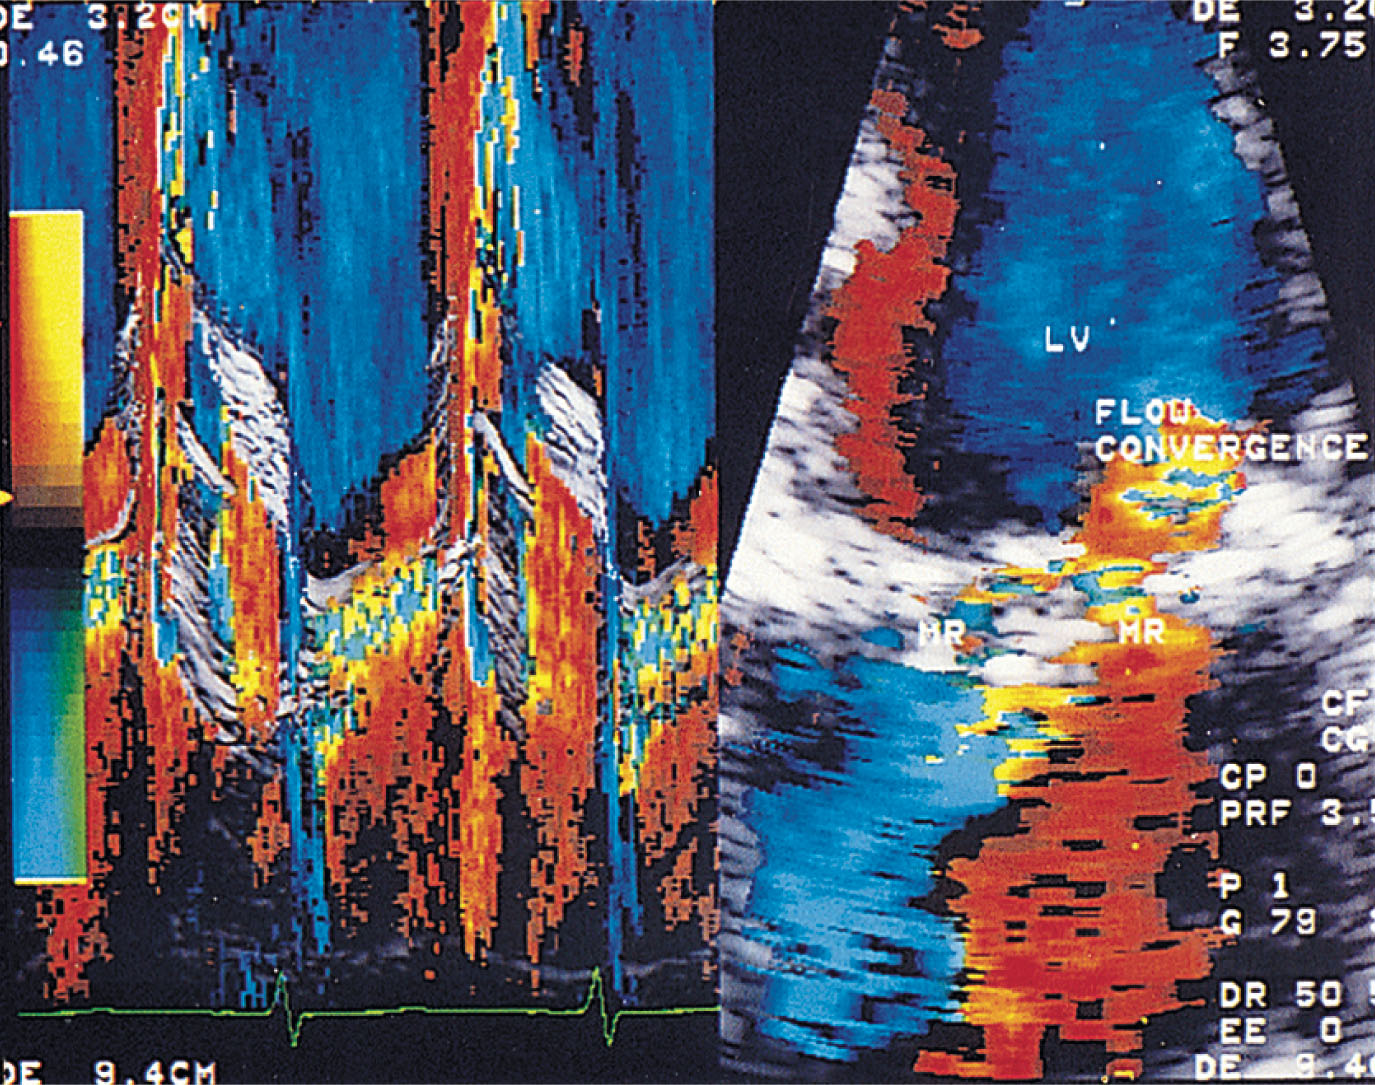
Although normal cardiac flows are difficult to accurately time during the CFM examination because of its slow frame rate, the use of color M-mode (with a faster frame rate) allows one to precisely determine specific cardiac events in correlation with the ECG. The color M-mode is made in the same manner as a conventional M-mode study ( Fig. 32.8 ). The cursor is placed through the area of interest, and the flow is evaluated using an autocorrelation technique.
Doppler echocardiography is established as a valuable, noninvasive tool in clinical cardiology to provide hemodynamic information about the function of the cardiac valves and chambers of the heart. When combined with conventional 2D echo, Doppler techniques may be focused to provide specific information on the velocity flow patterns of a particular area within the heart. The ability to provide qualitative and quantitative information in evaluating valvular function, intracardiac shunts, dysfunction of a native or prosthetic valve, or the obstruction of a surgically inserted shunt has contributed to the clinical care of the cardiac patient. Understanding cardiac physiology and hemodynamics is critical to the interpretation of the Doppler information. In addition, the sonographer must clearly understand Doppler principles, artifacts, and pitfalls in order to produce a quality study.
Understanding the relationship between the 2D echo and the Doppler flow study is important. The 2D echo allows assessment of cardiac anatomy and function; Doppler velocity flow analysis allows examination of blood flow rather than cardiac anatomy. The Doppler principle on which this technique is based involves the backscatter of transmitted ultrasonic waves from circulating red blood cells. The difference in frequency between transmitted and backscattered sound waves (Doppler shift) is used to quantify forward or backward blood flow velocity.
The Doppler signals should be obtained with the sample volume parallel to the direction of flow. Recall that the flow of blood occurs in three-dimensional space, whereas the real-time image is only in two dimensions. Therefore the two-dimensional image serves as a guide to the operator as small adjustments of the transducer and sample volume are made in the valve orifice to record the optimal Doppler signals. The key is to produce a spectral signal to show a well-defined velocity envelope along with a clearly defined audio tone. The clarity of the audio tone cannot be emphasized enough. Frequently the clarity of tone is used to guide the Doppler cursor into the correct plane to record the maximum velocity.
Blood flow toward the transducer is displayed by a time velocity waveform above the baseline at point zero or a positive deflection ( Fig. 32.9 ). Flow away from the Doppler signal is displayed below the baseline or as a negative deflection. A simultaneous ECG should be displayed to help time the cardiac cycle.
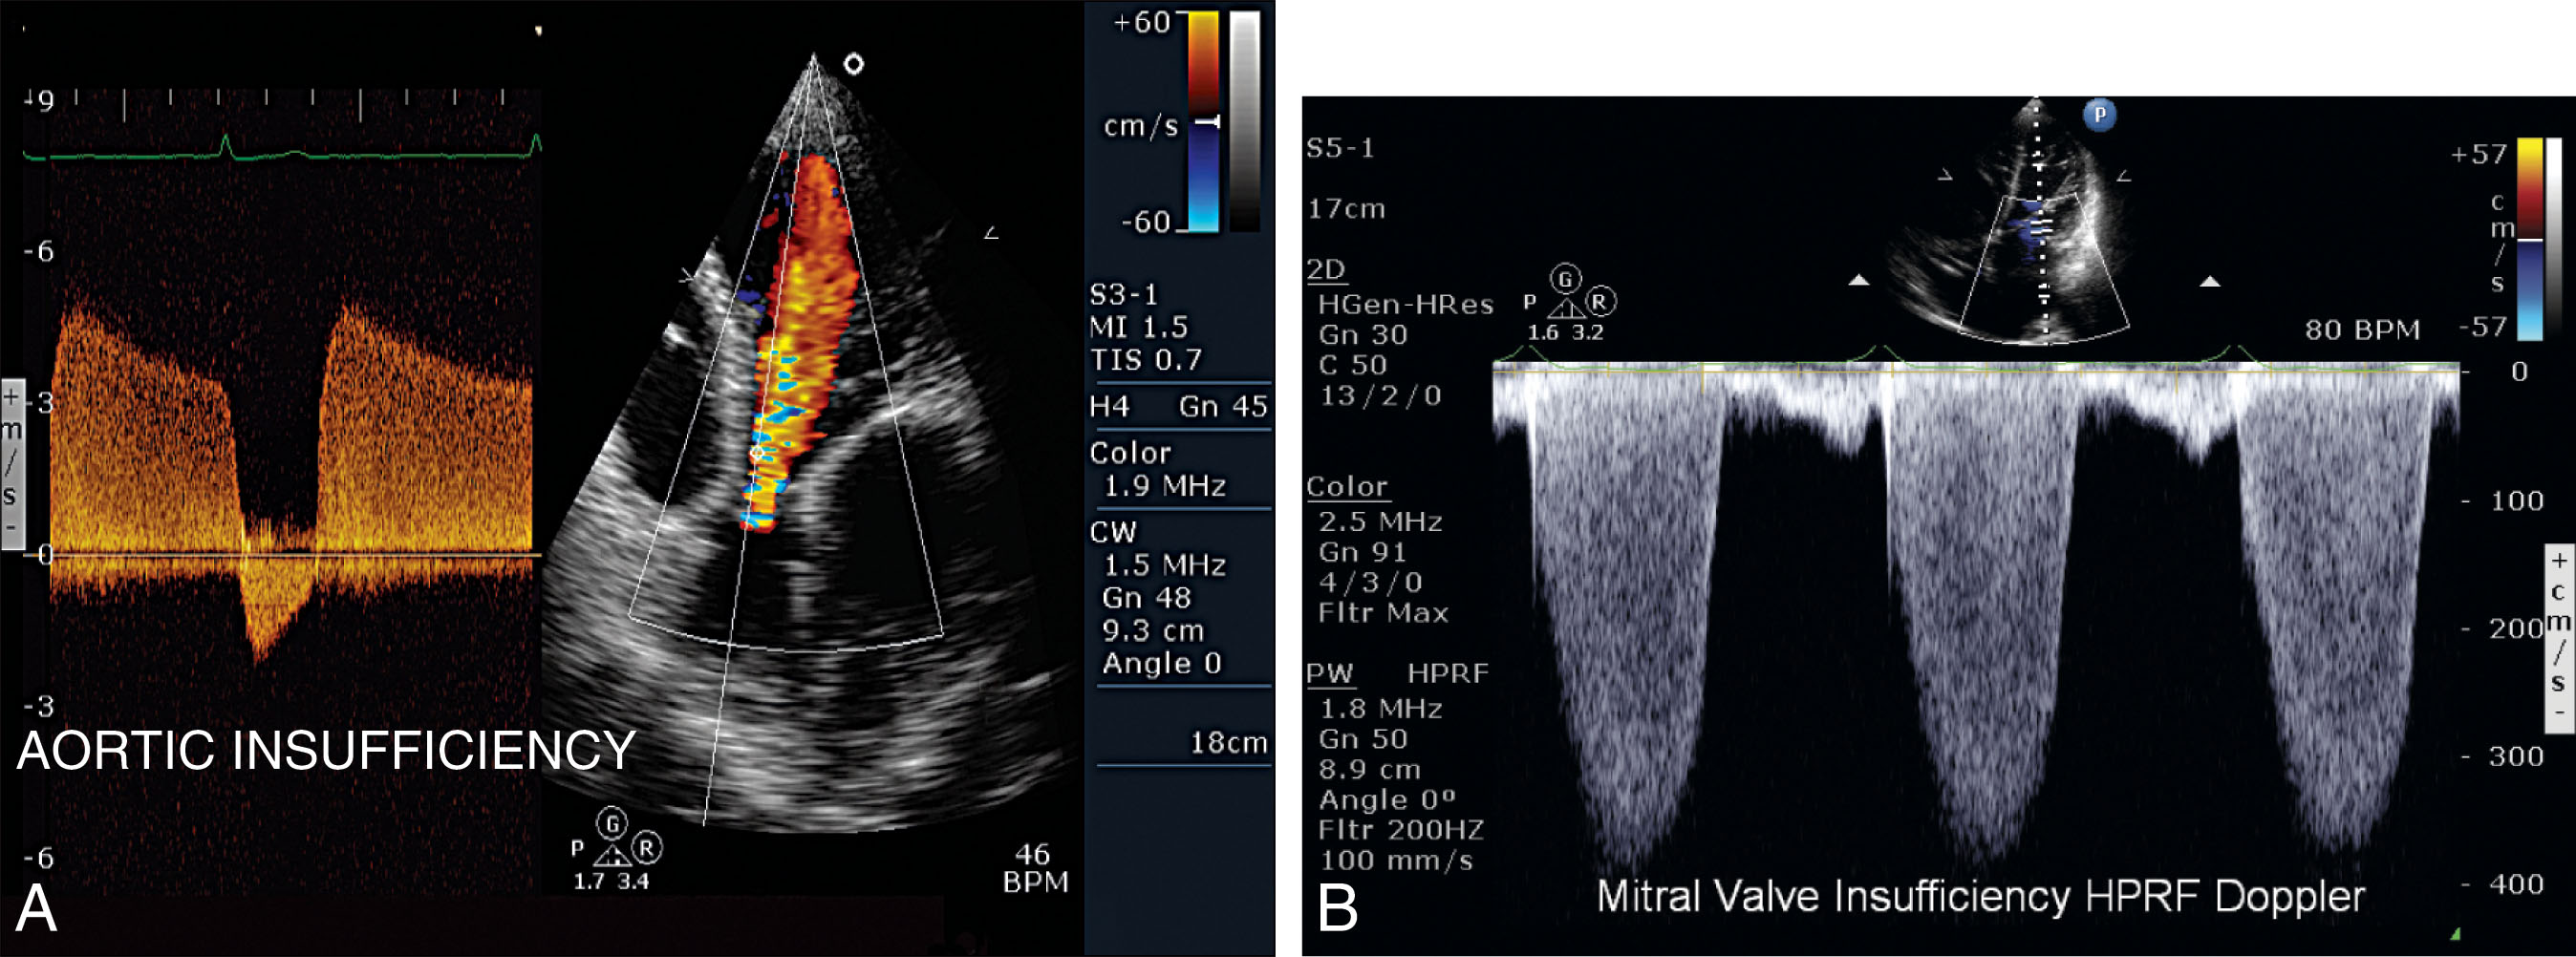
The best Doppler signals are obtained when the ultrasound beam is parallel or nearly parallel to the flow of blood; therefore the best windows used to record the 2D images may not be the best windows to record Doppler flow patterns. This section discusses the technique for recording quality Doppler signals from the inflow and outflow tracts through the cardiac valves.
Doppler produces an audible sound which helps guide the sonographer to obtain the highest velocity signal. The signal from the arterial flow is very different from that of the venous flow; likewise, mitral and tricuspid patterns differ from the aortic and pulmonary valve patterns. The blood flow velocity determines the pitch or frequency of the audio signal. As the velocity becomes higher, the pitch becomes higher; as the velocity decreases, so does the pitch.
Normal blood flow across the cardiac valves demonstrates a narrow range of velocity with a smooth and even Doppler audio signal. When the flow becomes disturbed, as occurs distal to an obstruction or regurgitation of the valve, the tone becomes harsh. The high-velocity flows produce a very high-frequency signal with a sharp whistling-hissing tone. This signal may be found in obstruction, shunts, and regurgitant lesions.
Other movements within the cardiac chambers produce audio signals, but these signals are not as well defined. The valve opening and closure can be heard as a discrete click when the Doppler window is located too close to the valve. The normal cardiac function causes the valve to move in and out of the Doppler beam, producing a lower-frequency signal. Therefore careful angulation along with the audio signal helps the sonographer observe the dynamics of the cardiac cycle for correct beam placement to obtain the best-quality Doppler signal.
The spectral analysis waveform allows the sonographer to store a graphic display of what the audio signal is recording because it provides a representation of blood flow velocities over time. The velocity on the vertical axis is measured in centimeters per second or meters per second, and time is shown on the horizontal axis ( Fig. 32.10 ). Therefore the direction and velocity of flow may be measured very accurately when the beam is parallel to the flow.
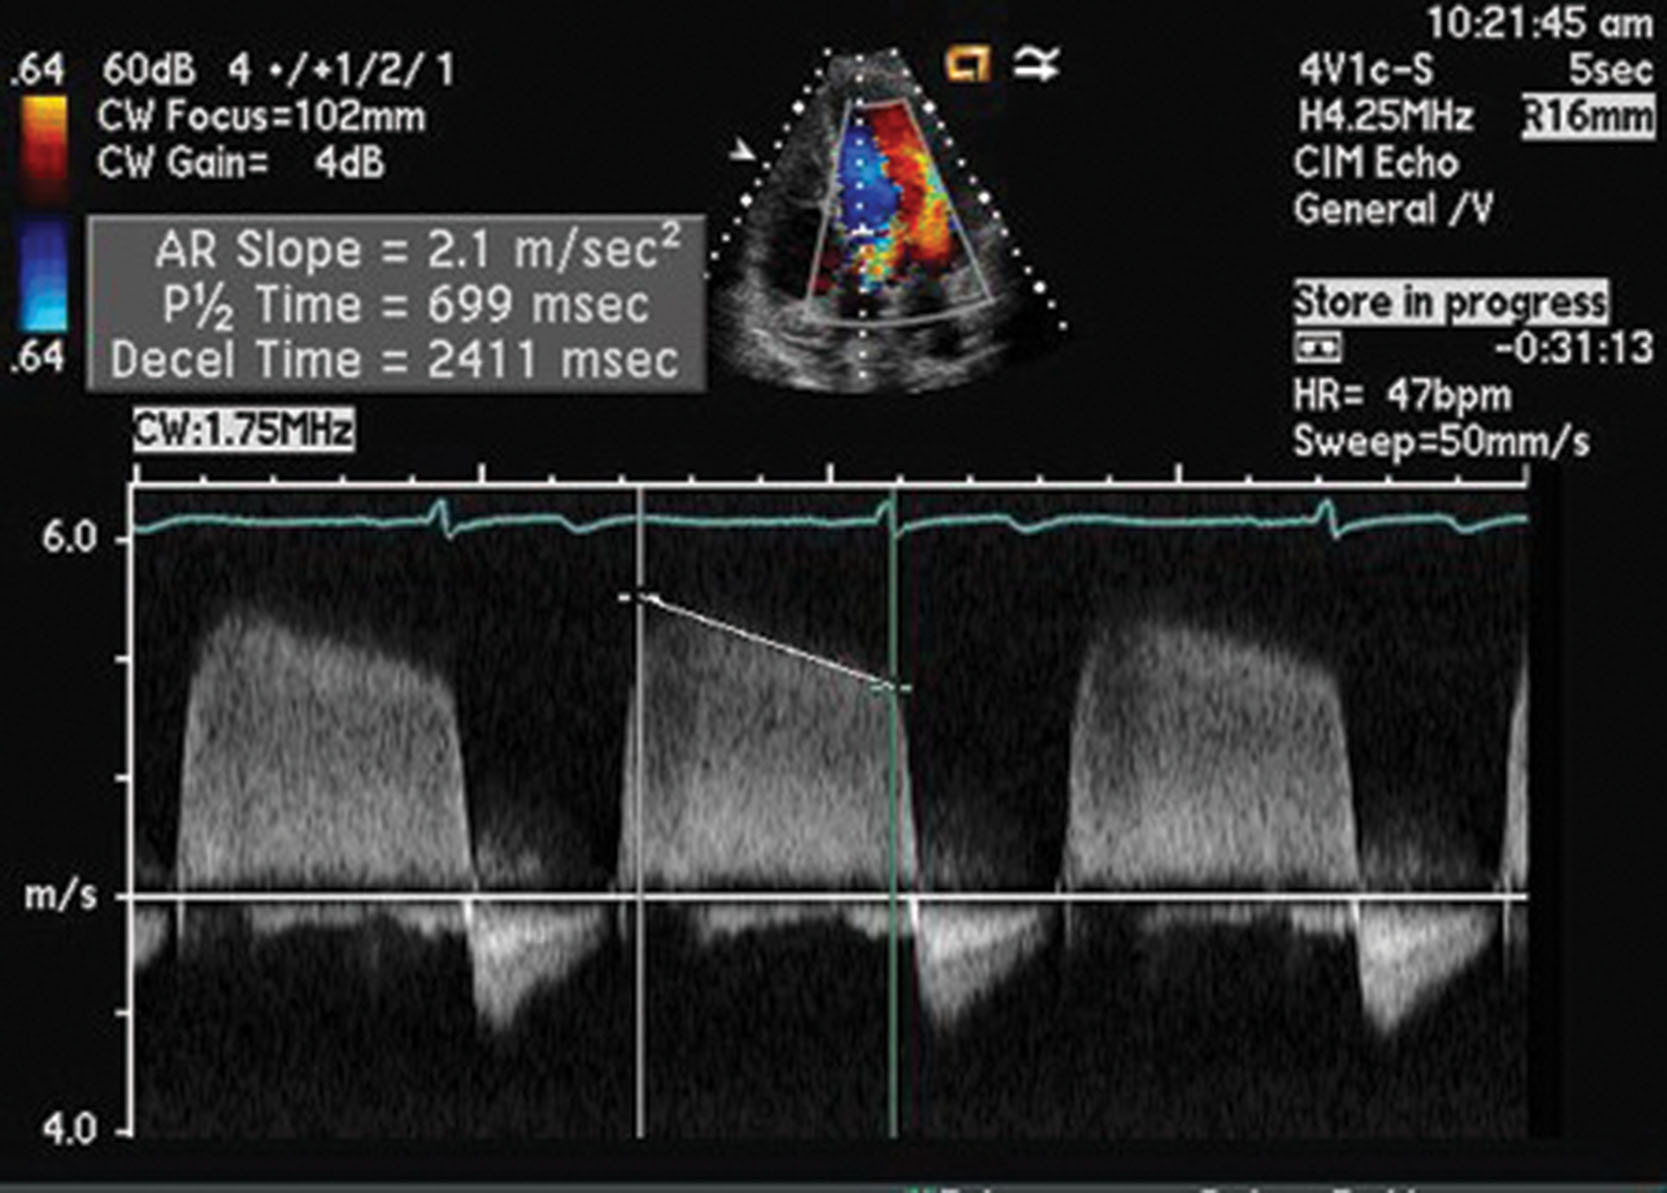
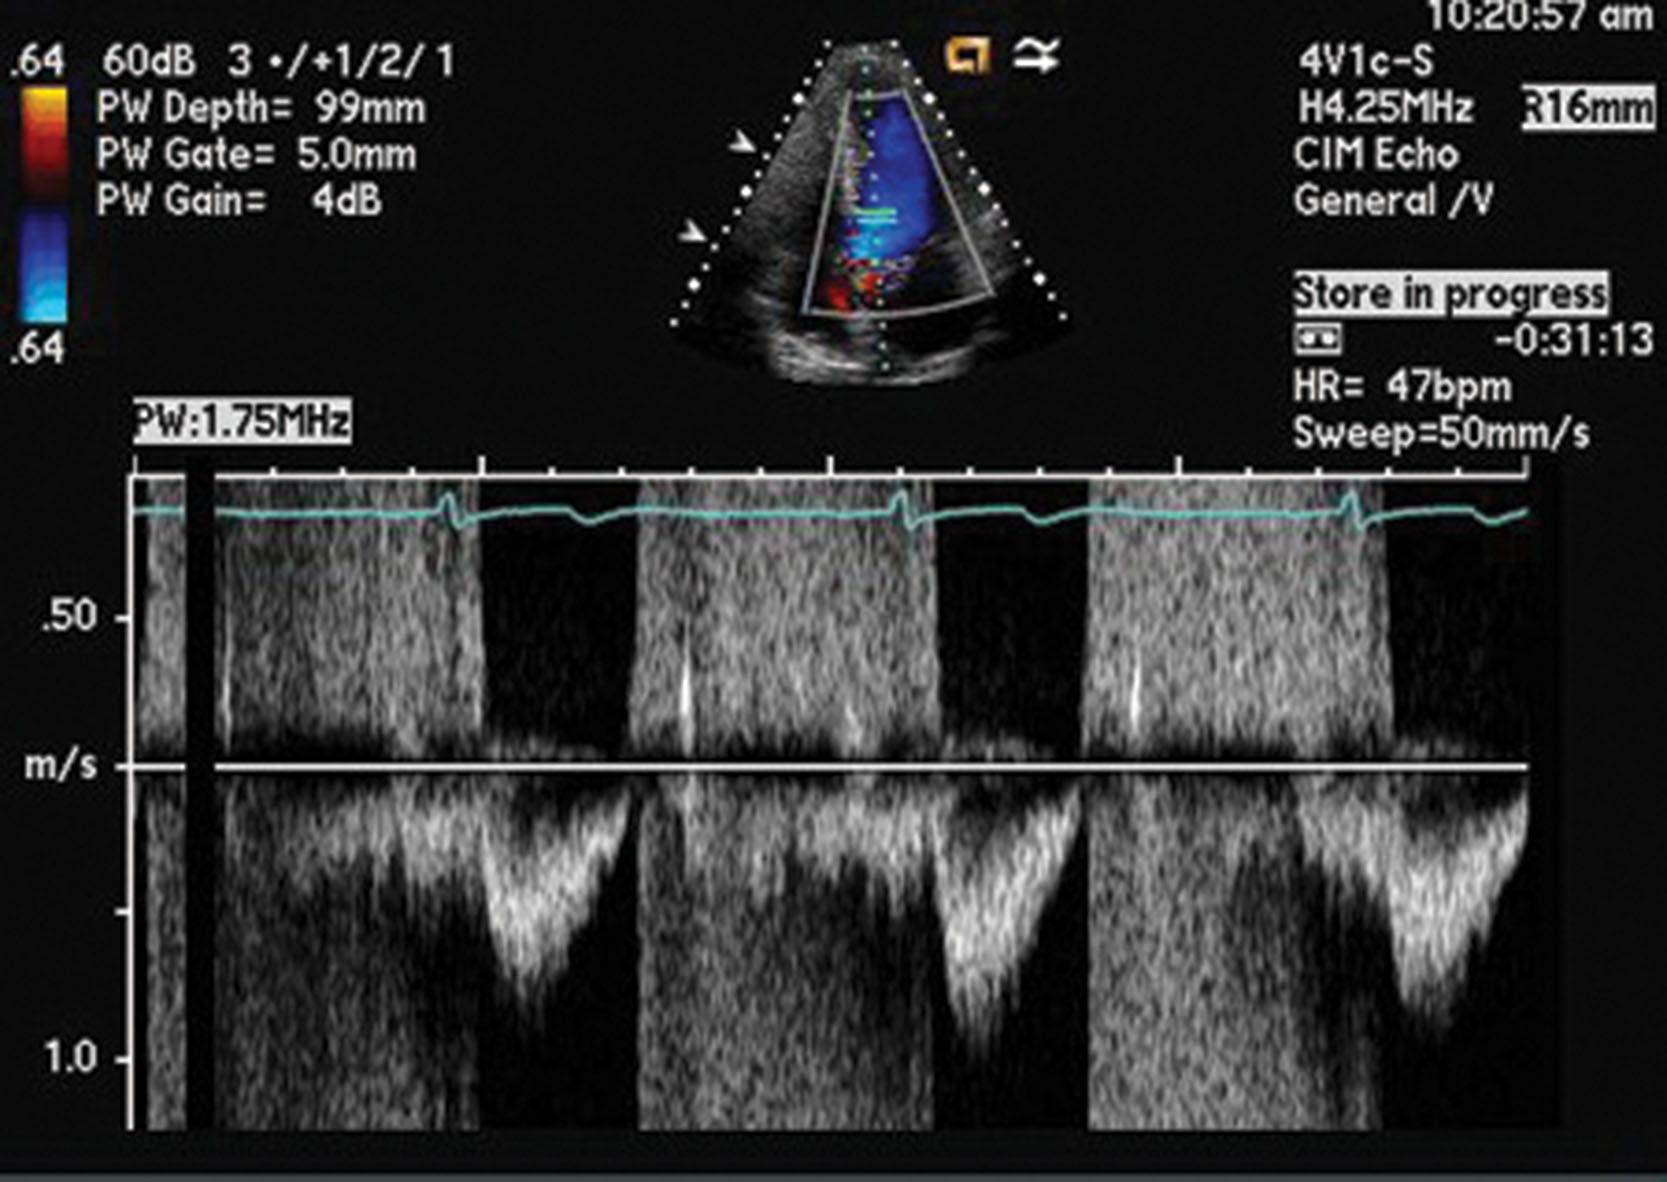
A normal spectral display pattern has a typical appearance. In normal blood flow, the cells generally have a uniform direction with similar velocities. The spectral tracing appears as a smooth mitral velocity pattern bordered by a narrow band of velocities. As the velocity increases, so does the turbulence within the border of the narrow-band velocities, producing a filling of the velocity curve. As the cardiac structure moves in and out of the beam, the Doppler frequency shift is recorded as tall artifact spikes.
There are two types of Doppler signals that are utilized in echocardiography: pulsed wave and continuous wave ( Fig. 32.11 ).
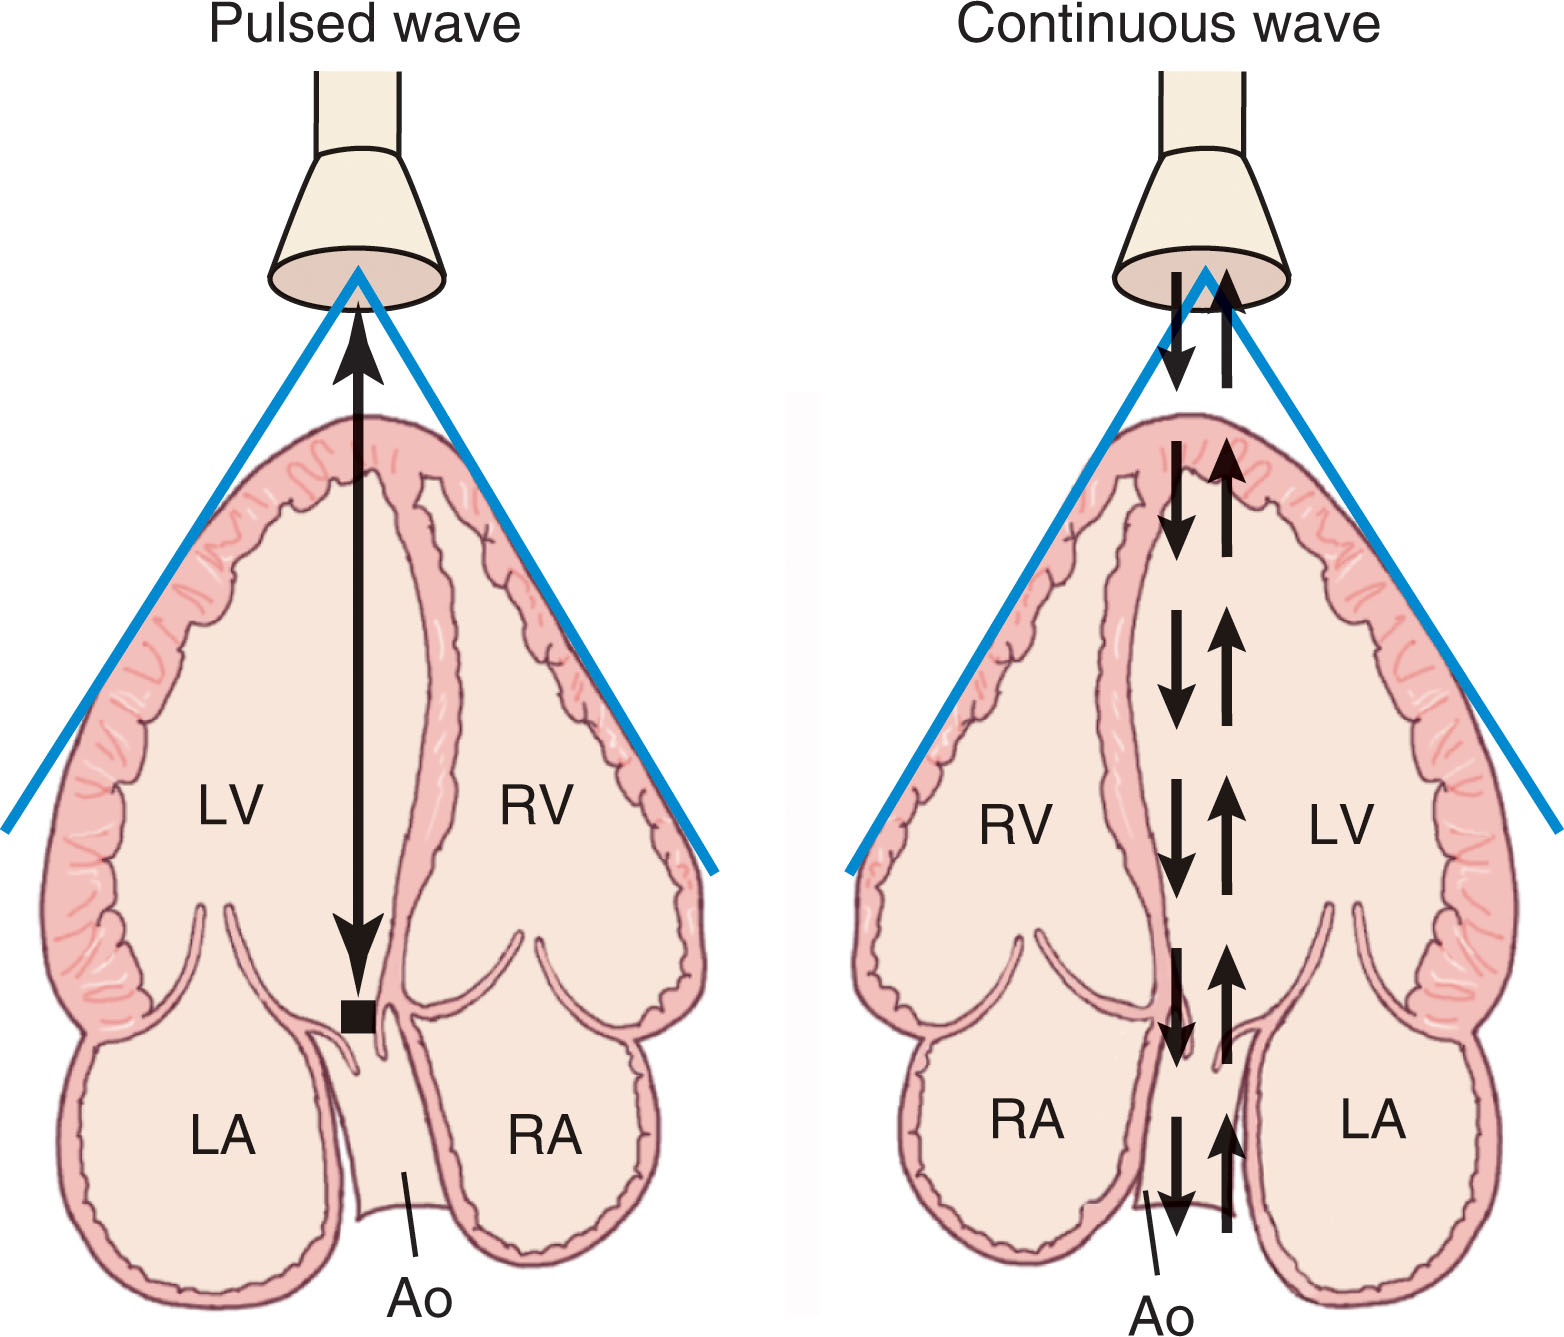
A pulsed wave transducer is constructed with a single crystal that sends bursts of ultrasound at a rate called the pulse repetition frequency (PRF). The transducer receives sound waves backscattered from moving red blood cells during a limited time between transmitted pulses. A time gating device is then used to select the precise depth from which the returning signal has originated because the signals return from the heart at different times.
The particular area of interest undergoing Doppler evaluation is referred to as the sample volume. The sample volume and directional line placement of the beam are moved by use of the trackball. The exact size and location of the sample volume can be adjusted at the area of interest. Some instruments have a fixed sample volume size. Others allow the operator to select the size appropriate for the particular study.
Velocities less than 2 m/sec are recorded without an alias pattern. However, pulsed Doppler is limited in its ability to record high-velocity patterns. The maximum frequency shift that can be measured by a pulsed Doppler system is called the Nyquist limit and is one-half the PRF. Velocities that exceed this limit are known to produce an aliasing pattern ( Fig. 32.12 ). Normal cardiac structures do not exceed the Nyquist limit and are easily measured with the pulsed Doppler system.
The continuous wave probe differs from the pulsed wave probe in that it is able to both send and receive sound (see Fig. 32.11 ). One crystal continuously emits sound; the other receives sound as it is backscattered to the transducer. This probe may be part of a phased or annular array imaging probe or may be a stand-alone independent probe. If it is part of a 2D imaging transducer, the sample direction can be steered by use of the trackball.
The Pedof continuous wave (nonimaging) probe is smaller than the 2D imaging probe and thus has advantages in obtaining a good Doppler study ( Fig. 32.13 ). This small diameter allows greater flexibility to angle between small rib interspaces or obtain signals from the suprasternal notch or right parasternal border. The audio portion of the Doppler examination becomes a critical factor in this study because 2D is not available to guide the transducer location.
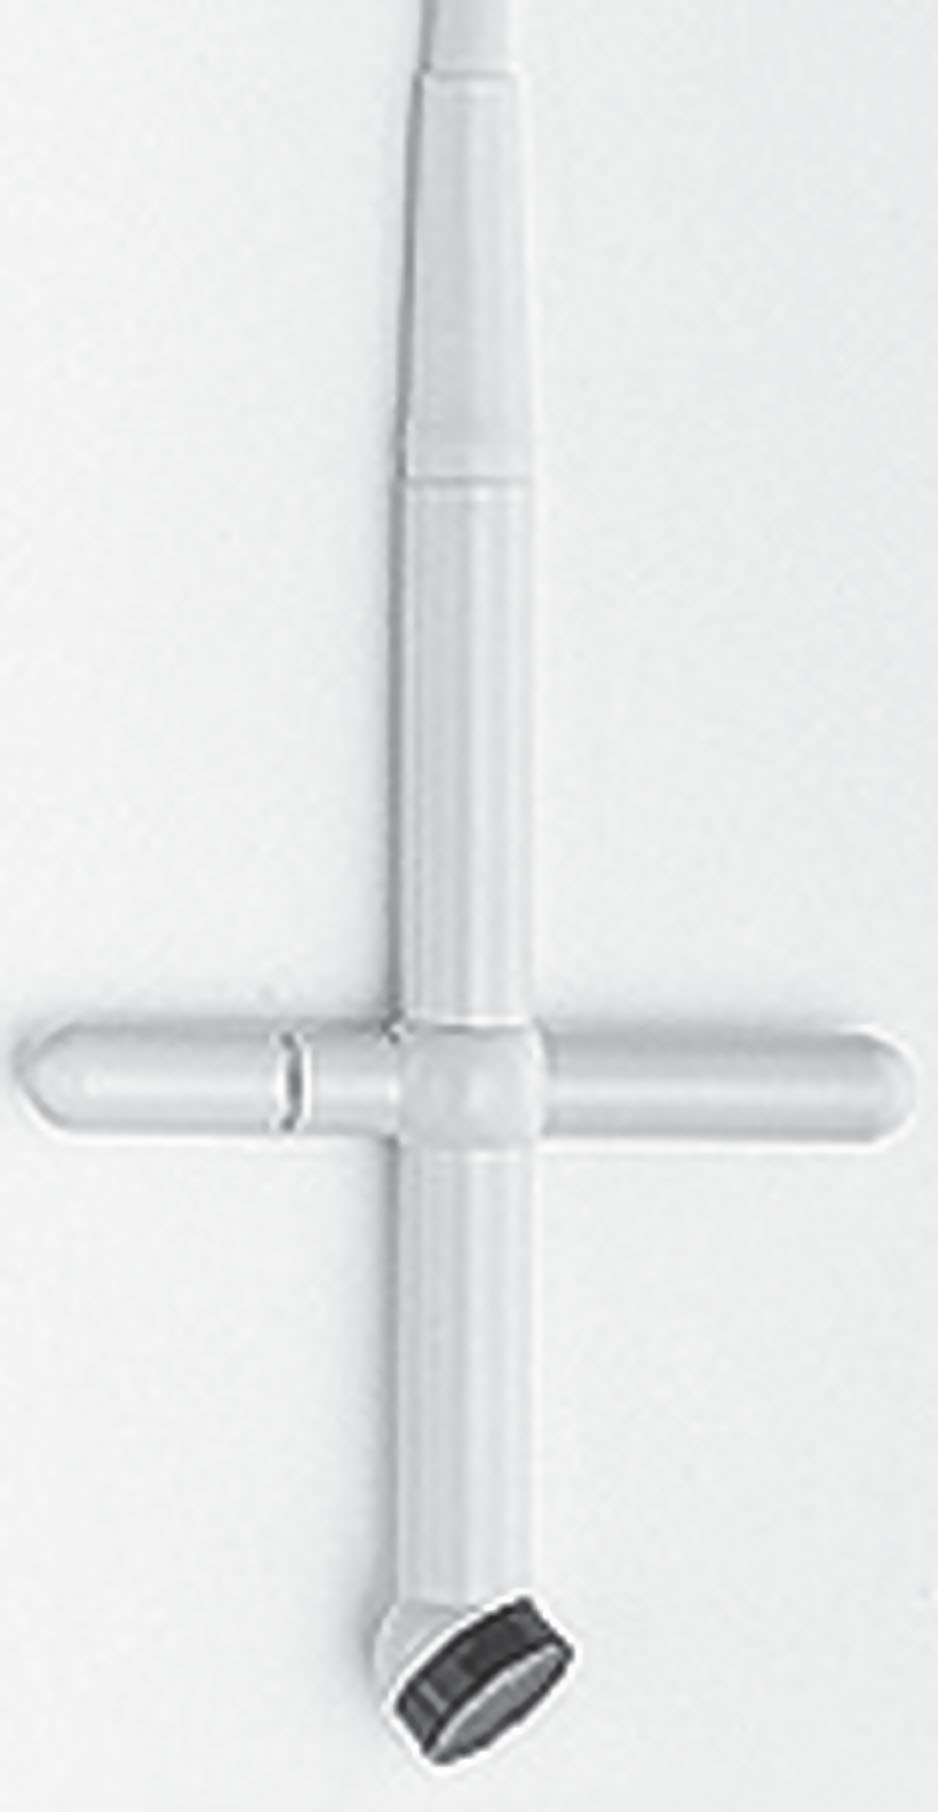
Often both 2D–continuous wave and Pedof probes are used within the echocardiographic study. Once the proper transducer position is found with the imaging transducer, the angulation and window are marked for proper placement of the Pedof probe. The audio sound and spectral wave pattern are then used to guide the correction angulation of the beam for maximum-velocity recordings. Because there is not a particular sample volume site within the continuous wave beam, velocities are recorded from several points along the linear beam. This technique has the ability to record maximum velocities without alias patterns and is especially useful for very high-velocity patterns, as seen in regurgitant lesions or stenotic valves.
Quantitation of the Doppler signal to obtain hemodynamic information is derived from the measurement of blood flow velocity ( Table 32.1 ). As explained previously, it is critical that the angle of the Doppler signal be as parallel to flow as possible. The Doppler equation is based on the principle that the velocity of blood flow is directly proportional to the Doppler frequency shift and the speed of sound in tissue, and it is inversely related to twice the frequency of transmitted ultrasound and the cosine of the angle of incidence between the ultrasound beam and the direction of blood flow. Therefore the relationship between the angle and its cosine becomes significant and can be a source of error if ignored. If the angle is less than 20 degrees, the cosine is close to 1 and can be ignored. If the angle increases beyond 20 degrees, the cosine becomes less than 1 and may produce an underestimation of velocity.
| Children (cm/sec) | Adults (cm/sec) | |
|---|---|---|
| Mitral flow | 80–130 | 60–130 |
| Tricuspid flow | 50–80 | 30–70 |
| Pulmonary artery | 70–110 | 60–90 |
| Left ventricle | 70–120 | 70–110 |
| Aorta | 120–180 | 100–170 |
The Doppler examination is performed along with the 2D study of the cardiac structures. During this conventional study, the sonographer notes structures that may need special attention during the Doppler examination (e.g., a redundant mitral valve leaflet may indicate the need to search for mitral regurgitation). Throughout the Doppler study, various patient positions and transducer rotations are necessary to place the sample volume parallel to blood flow ( Box 32.2 ). There are basically five transducer positions used to record quality Doppler flow patterns: the apical four chamber, the left parasternal, subcostal, suprasternal, and the right parasternal. The patient should be forewarned about the audio sounds produced by the Doppler signal because some find the sound alarming if the volume is set too high.
Mitral valve, tricuspid valve, left ventricular outflow tract, aortic valve, pulmonary vein inflow, superior vena cava inflow, interventricular septum, interatrial septum
Pulmonary valve, main pulmonary artery, right and left branches pulmonary artery (patent ductus arteriosus flow), tricuspid valve
Become a Clinical Tree membership for Full access and enjoy Unlimited articles
If you are a member. Log in here