Physical Address
304 North Cardinal St.
Dorchester Center, MA 02124

Inherited metabolic disorders are challenging to diagnose because they have variable clinical severity and age at presentation, are uncommonly encountered, and can have a range of imaging appearances. The variability in clinical manifestation and imaging appearance relates to the underlying genetic mutation and degree of protein function remaining. Some metabolic disorders can have infantile, juvenile, and adult forms. Many of the metabolic disorders can be determined through laboratory studies and genetic evaluation; however, a radiologist may be the first person to trigger this investigation through recognition of imaging findings that suggest a metabolic or genetic etiology. This chapter discusses some of the clinical features most common to each disorder to provide a clinical context for the imaging findings. Last, this chapter discusses toxic disorders that affect children, which are important to recognize because some of these disorders may be reversible if the toxin is removed.
Magnetic resonance imaging (MRI) is the primary modality for evaluating metabolic and genetic disorders because MRI provides the greatest assessment of the brain parenchyma through the contrasts in tissue as well as with MR spectroscopy.
As mentioned previously, the variability in genetic mutation and remaining protein function leads to potentially different appearances for the same disorder, which can lead to difficulty in reaching the specific diagnosis. In these situations, excluding or indicating a potential metabolic or genetic disorder has value as it can either prevent or lead to a series of laboratory and genetic testing.
This section illustrates some of the many metabolic disorders in children. Although imperfect, this chapter is organized using an imaging pattern approach to provide manageable differential diagnoses. This provides a starting point for forming a knowledge base of metabolic disorders and emphasizes important structures that should be assessed systematically. This approach combined with clinical information, particularly age of presentation and specific clinical features highlighted in this section, can help lead to an appropriate differential diagnosis or specific diagnosis.

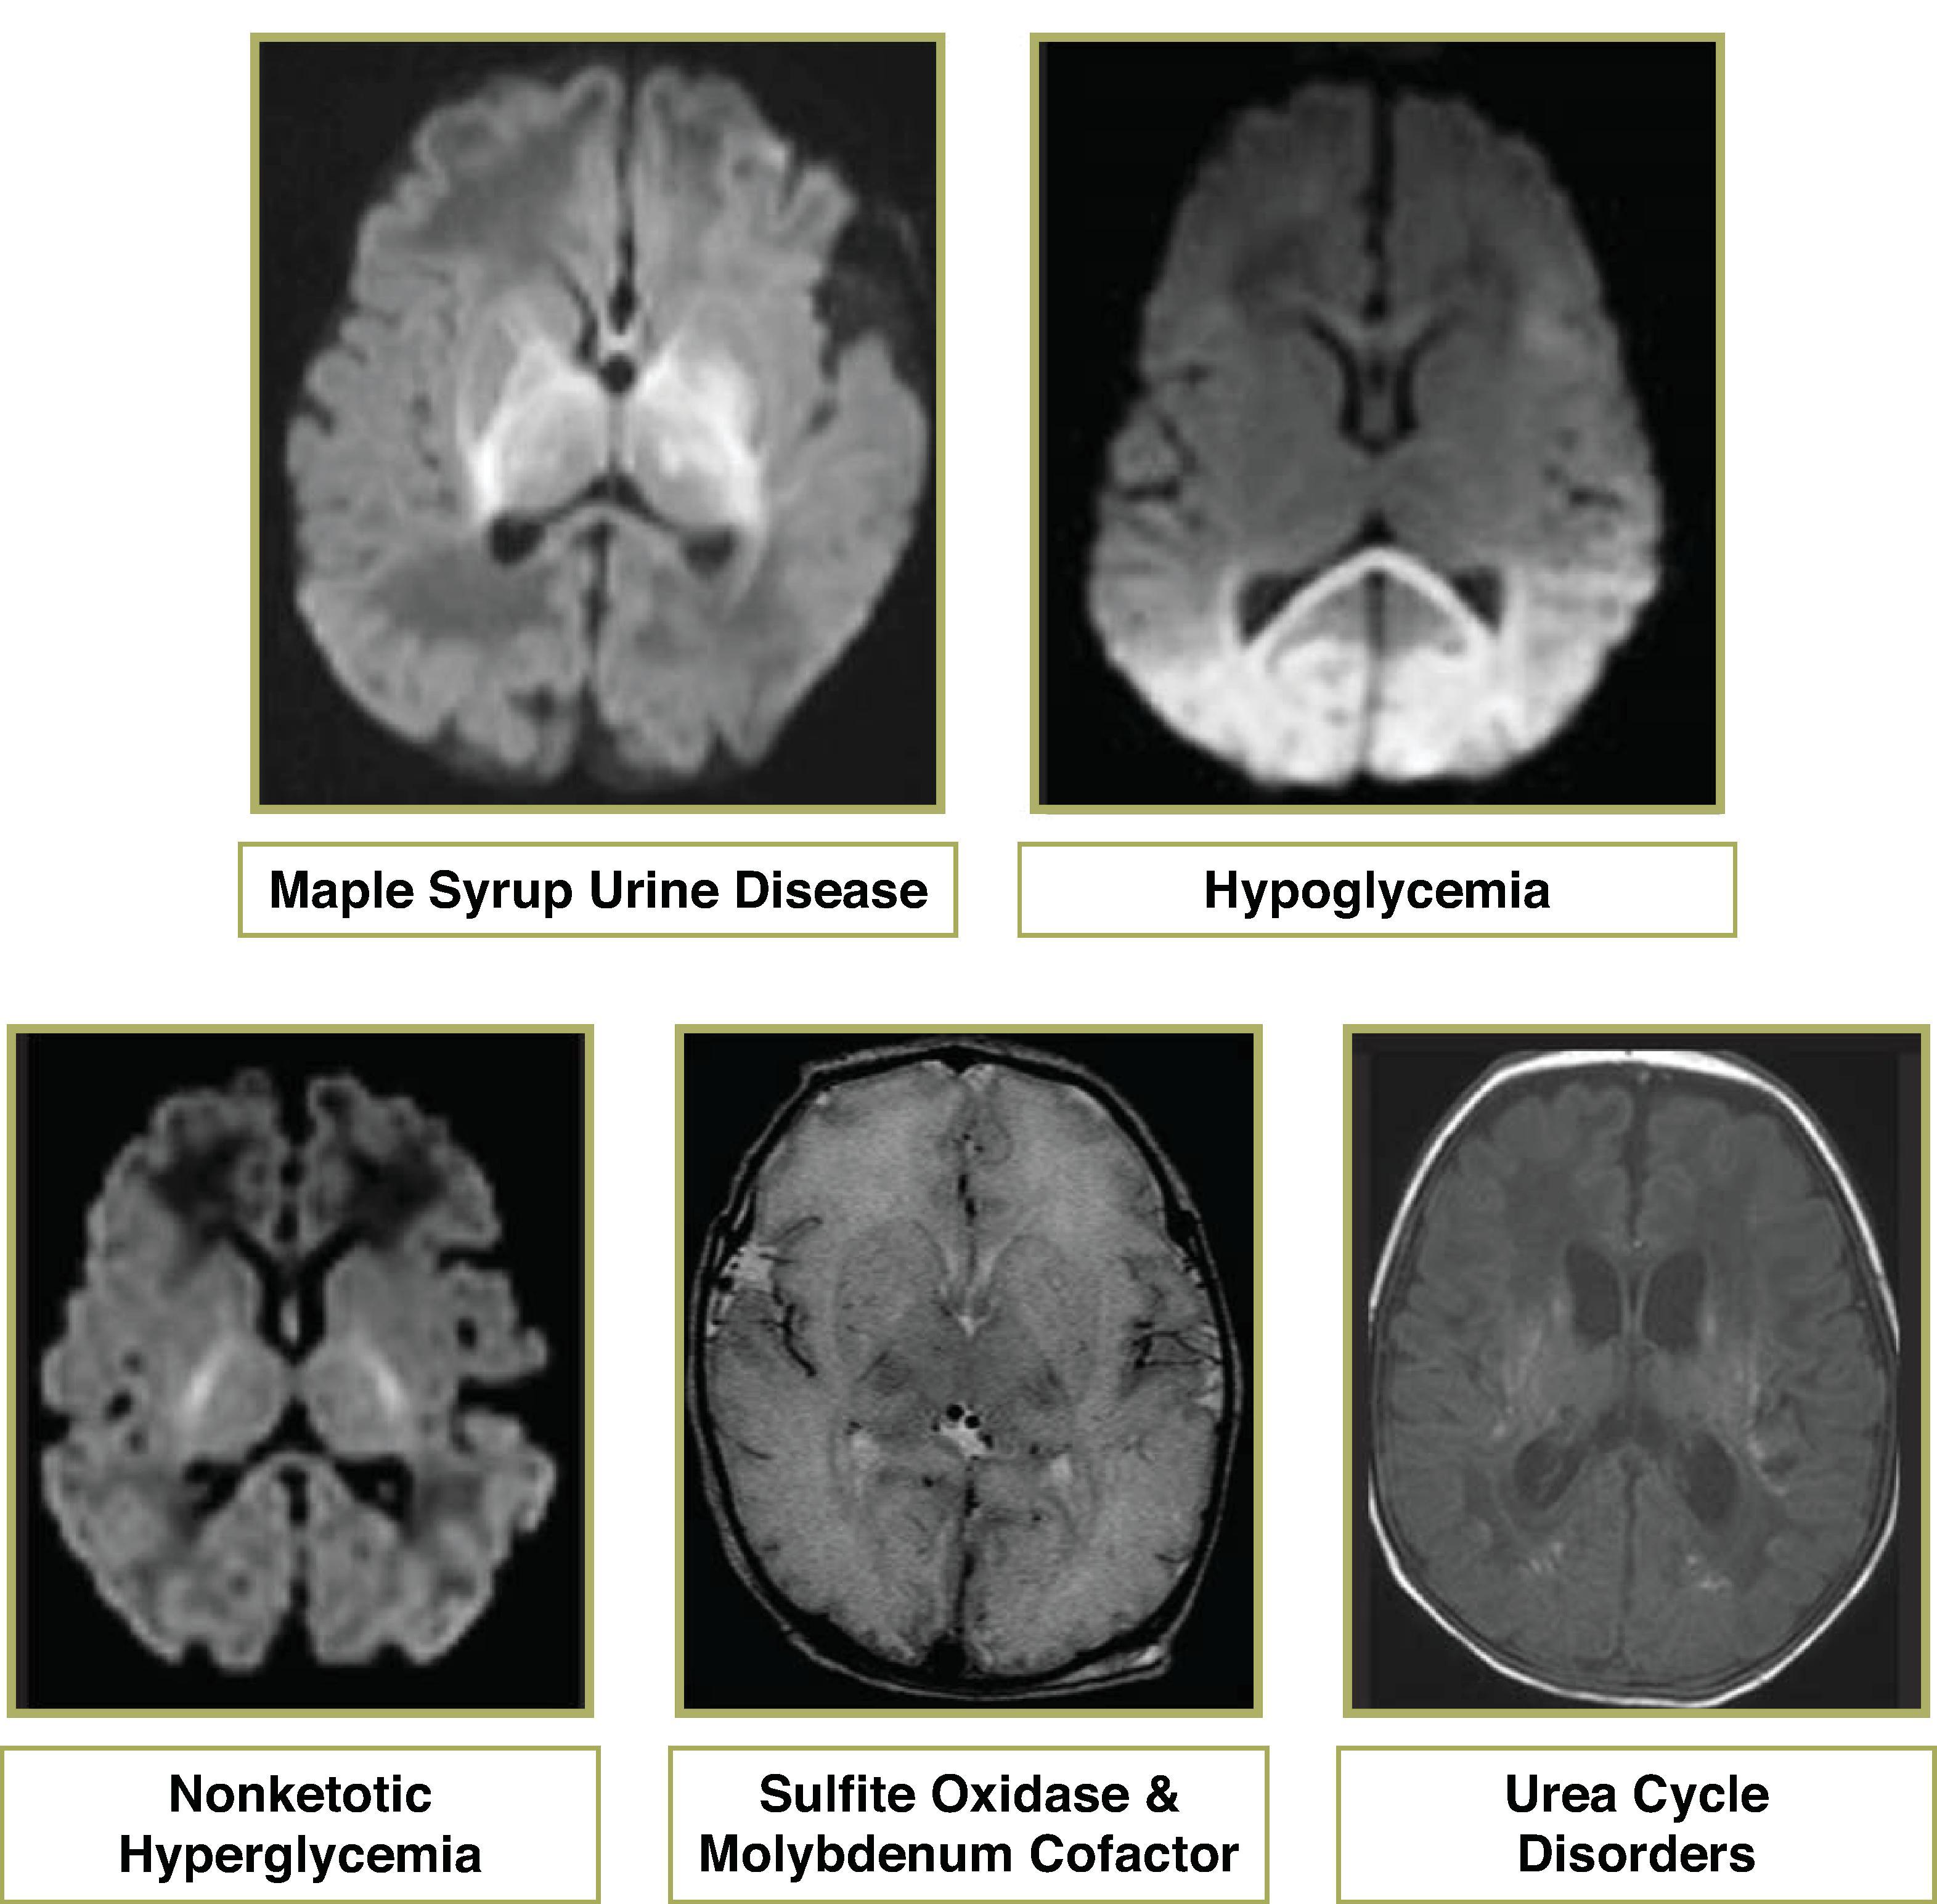

Autosomal recessive deficiency of branched-chain alpha-keto acid dehydrogenase
Leads to accumulation of branch chain amino acids, which result in extracellular intramyelin edema and demyelination
Classical form is the most common and presents in the first week of life; disease-free interval of 4 to 7 days followed by lethargy, feeding difficulty, apnea; rapid progression to cerebral edema, coma, and death within 1 month if untreated
Elevated branched-chain amino acids in the urine, blood, and CSF
Prognosis is good if detected early and dietary control is maintained
Diffusion restriction along corticospinal tracts and myelinated white matter; T2W-hyperintense signal in areas of normal myelination
MRS: broad peak at 0.9 ppm on short and long echo, which is caused by branched-chain amino acids


Etiologies include hyperinsulinism, endocrine deficiency, and metabolic disorders.
Hypoglycemia → decreased pyruvate and lactate → tissue alkalosis → selective neuronal necrosis of the cerebral cortex (typically parietal and occipital lobes), hippocampus, caudate, and potentially the spinal cord. The reason for the predilection of injury to the parietooccipital areas remains unknown.
Hypoglycemia has a greater effect on the superficial cortical layers, while hypoxic ischemic injury has a greater effect on the middle cortical layers. Axon sparing and dendritic swelling is seen with hypoglycemic injury.
Sequela range from no impairment to epilepsy, visual impairment, mental retardation, and death
Acute phase will demonstrate diffusion restriction and T2W hyperintensity in the occipital lobes and posterior parietal cortex. Chronic phase will demonstrate volume loss and T2/FLAIR hyperintensity in the occipital lobes and posterior parietal lobes indicative of encephalomalacia and gliosis.
MRS: ↓ NAA and ↑ lactate in acute and subacute phases

Autosomal recessive disorder of the glycine cleavage system (a mitochondrial multi-enzyme complex) leading to glycine accumulation
Pathologically demonstrates development of vacuoles in the myelinGlycine potentiates the excitotoxic action of glutamate in the brain.
Presents within first 4 days of life; signs and symptoms include seizures, hypotonia, apnea, dystonia, and developmental delay.
Diagnosis made by elevated CSF: Plasma glycine > 0.08 (normal < 0.04)
Neonates present with T2W hyperintensity and reduced diffusion in the dorsal pons, midbrain, and posterior limb internal capsules . Older infants demonstrate delayed myelination and volume loss.
MRS: Glycine peak at 3.56 ppm is key to diagnosis . Must perform intermediate or long echo because glycine persists on short and intermediate/long echo while myo-inositol does not persist on intermediate/long echo


Autosomal recessive mutation in the SUOX gene which makes the enzyme sulfite oxidase. Loss of oxidation of sulfite to sulfate preventing the breakdown of sulfur-containing amino acids. It is uncertain whether pathogenesis is due to a toxic metabolite or deficient product
Variable clinical manifestation from neonatal onset with encephalopathy, seizure, and early death to late infantile onset with dystonia, hypotonia, and developmental delay
Elevated urinary excretion of sulfite, thiosulfate, and taurine
No effective treatment to date. Limitation of sulfur amino acids and cysteamine may help absorb excess sulfite
Acute presentation in the neonate period with diffusion restriction and T2W hyperintense signal in the cerebral cortex mimicking HIE
Chronic phase demonstrates diffuse atrophy and cystic degeneration of the cerebral hemispheres, cerebellar and deep gray matter atrophy
MRS: ↓ NAA and ↑ lactate in acute and subacute phases

Autosomal recessive. The cofactor is formed by molybdopterin and molybdenum
Results in simultaneous loss of all cofactor-dependent enzymes, including sulfite oxidase, xanthine dehydrogenase, and aldehyde oxidase
Uncertain whether pathogenesis is due to a toxic metabolite or deficient product
Neonatal presentation with seizure, axial hypotonia, limb hypertonia, and feeding difficulty. Most patients die at an early age.
Similar imaging pattern to sulfite oxidase that resembles severe hypoxic ischemic injury
MRS: ↓ NAA and ↑ lactate in acute and subacute phases


Five common urea cycle defects include: carbamoyl phosphate synthetase deficiency (CPSD), ornithine transcarbamylase deficiency (OTCD), argininosuccinate synthetase deficiency (ASSD/citrullinemia), argininosuccinate lyase deficiency (ASLD), arginase deficiency
Autosomal recessive, except OTCD, which is X-linked recessive
Histopathology: Elevated ammonia leads to astrocyte swelling and accumulation of glutamine
Clinical features are similar with exception of ASLD, which has a slow, progressive course; hyperammonemia is present except in arginase deficiency; most present in the neonatal period with lethargy, hypotonia, seizure, coma, and rapid progression to death or severe neurologic sequela. Late-onset disease is chronic and episodic in response to infection, high protein intake, trauma, surgery, or valproate.
Treatment includes limiting protein intake as well as dialysis and lactulose medication.
Neonates often demonstrate diffuse edema in the cerebral hemispheres and basal ganglia, and T1W shortening in the insula and perirolandic regions.
Older infants and children may demonstrate asymmetric infarct-like patterns of cortical and subcortical involvement.
Chronic stage demonstrates atrophy and gliosis.
MRS: Acute phase may demonstrate ↑ lactate and glutamate/glutamine.


Most cases are caused by a sporadic de novo mutation.
Deficiency of glial fibrillary acidic protein (GFAP) leads to astrocyte dysfunction white matter destruction, and accumulation of Rosenthal fibers (subependymal, subpial, and perivascular locations).
Laboratory assessment is not helpful. Biopsy demonstrates Rosenthal fibers.
Infantile onset (ranging from birth to early childhood) is the most common (typically presents at 6 months) and presents with macrocephaly, seizures, spasticity, and feeding difficulty.
Juvenile onset (4–14 years of age) often presents with bulbar and pseudobulbar symptoms.
Adult onset (second to seventh decade) has variable clinical features; no specific treatment.
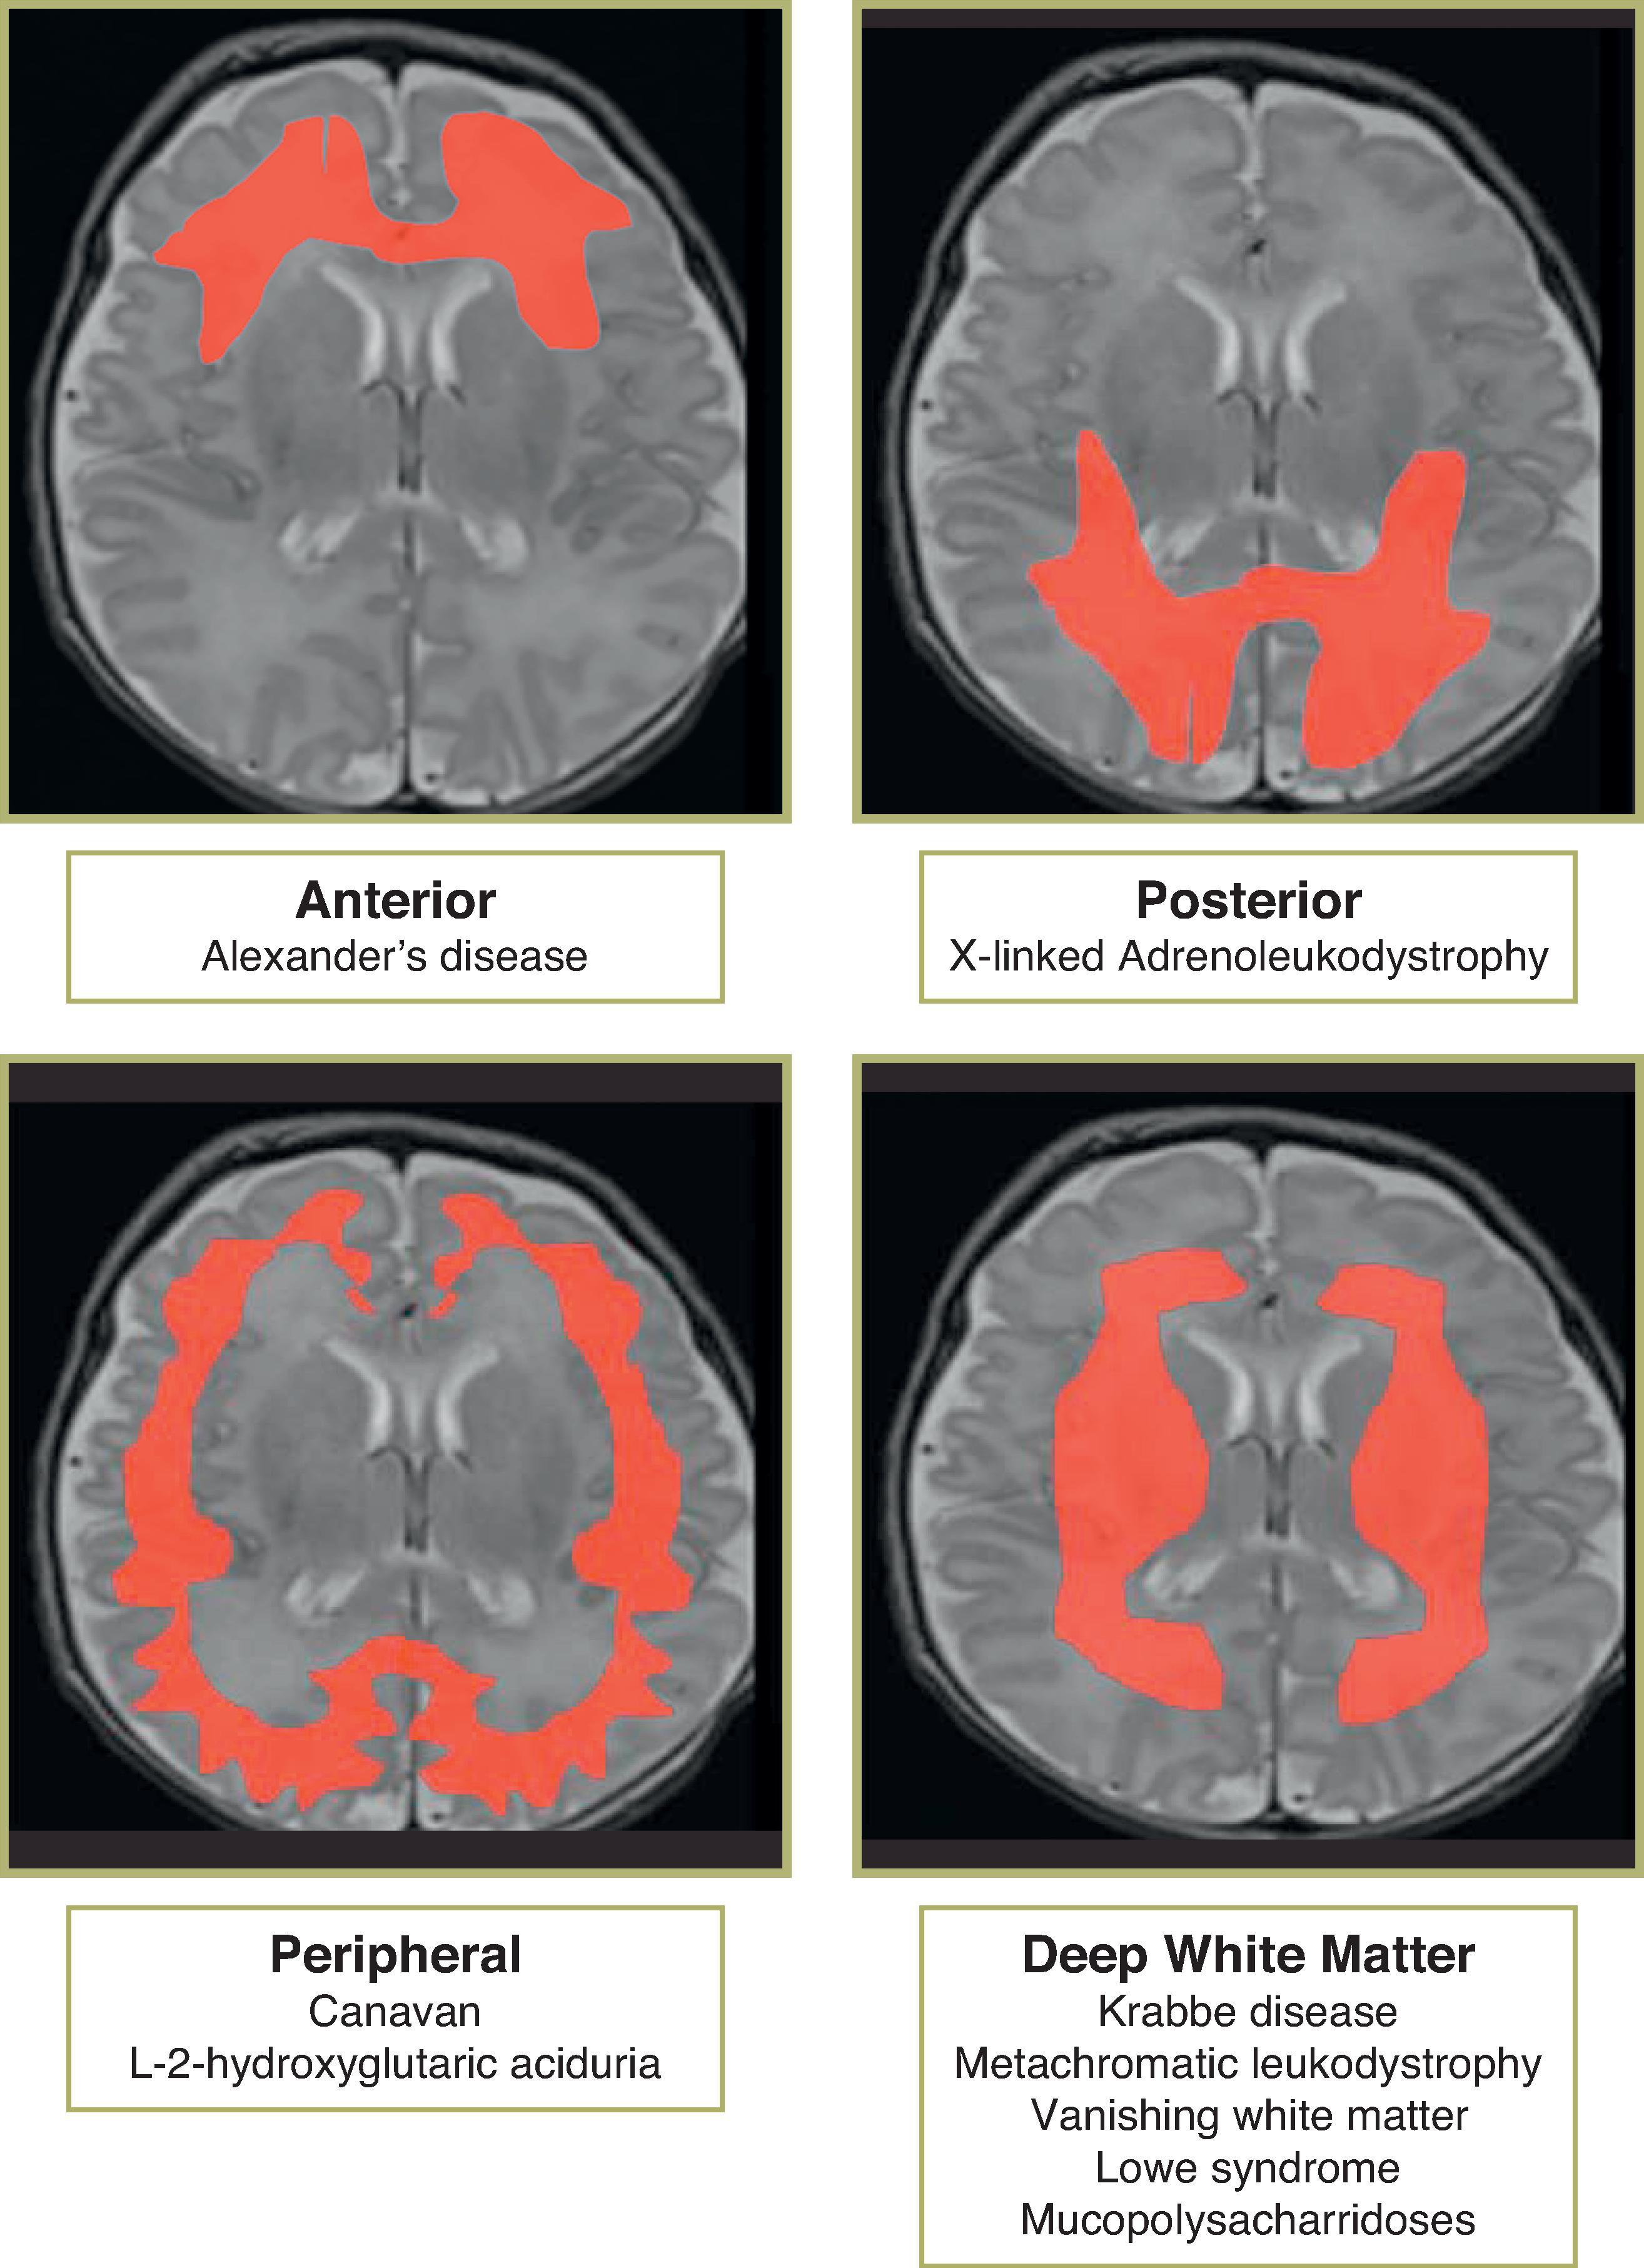
Confluent anterior white matter T2 FLAIR hyperintense signal and can also involve periventricular white matter, fornix, basal ganglia (BG), thalami, dentate, and brainstem
Parenchymal enhancement can occur from Rosenthal deposition (presumably from impaired blood-brain barrier due to dysfunction of astrocyte foot processes caused by Rosenthal fiber accumulation), can result in expansion of the tectal plate and narrowing of the cerebral aqueduct, mimicking a tectal glioma
Diffusion restriction not typically seen
MRS: Nonspecific ↓ NAA, ↑ lactate

X-linked recessive disorder of adrenoleukodystrophy (ALDP), a peroxisome membrane protein, involved in peroxisome metabolism leading to impaired beta-oxidation of very long chain fatty acids (VLCFA); VLCFA accumulation in myelin → demyelination → microglial response
Pathology demonstrates a leading edge of demyelination with axonal sparing, middle zone of active inflammation, and central area of necrosis
Loes scoring system used to assess disease severity and guide decision on bone marrow transplantation
Presentation usually age 4 to 8 years; early neurologic manifestations include vision loss, gait abnormality, and auditory symptoms, which progress to spastic quadriplegia, epilepsy, dementia, and vegetative state or death within 1 to 5 years; adolescent and adult presentation can also occur
Diagnosed by detecting elevated plasma VLCFA; treated with replacement of adrenal hormones, and dietary restriction of saturated VLCFA combined with Lorenzo’s oil (a 4:1 mixture of glyceryl trioleate and glyceryl trierucate), and bone marrow transplantation
Outcome of bone marrow transplantation depends on degree of cerebral involvement at time of transplantation
Demyelination of splenium and posterior peritrigonal white matter, with sparing of the subcortical U fibers
Progresses to involve corticospinal tracts, fornices, commissures, visual and auditory pathways
Pathognomonic “leading edge” enhancement and reduced diffusion at active edge of demyelination
MRS: Nonspecific; depends on region evaluated; affected areas show ↑ Cho; ↓ NAA, ↑ lactate; late stage shows ↓ metabolites except ↑ myoI

Autosomal recessive mutation in aspartoacylase gene. Deficiency of aspartoacylase → elevated NAA brain. Pathogenesis of elevated NAA is unknown but includes acting as an osmolyte and leading to water accumulation in the brain, altered neurotransmission, synthesis of myelin lipids, and/or molecular water pump in myelinated neurons.
Elevated NAA in the urine and plasma is diagnostic.
Pathology demonstrates intramyelinic vacuole formation.
Infant presentation (age 6 months) is most common; macrocephaly, hypotonia, blindness, and seizures; rapidly progressive; leads to a vegetative state and often death before age 4.
No therapy presently exists for Canavan disease.
T2/FLAIR hyperintensity in the subcortical WM before deep WM
T2/FLAIR hyperintensity in the globus pallidi (typically sparing caudate and putamen) and thalami
Diffusion restriction can be seen in acute phase and may represent intramyelinic edema
MRS: Characteristic large NAA peak is a key finding

Autosomal recessive mutation in gene for L-2-hydroxyglutarate dehydrogenase, which is a mitochondrial protein.
Pathology demonstrates spongiform degeneration of the cerebral and cerebellar white matter with gliosis and vacuole formation.
Usually presents in the second year of life with macrocephaly, developmental delay, abnormal gait, and febrile seizures. Slowly progressive ataxia, tremor, and other neurologic signs and symptoms, including extrapyramidal signs.
Diagnosis made by detection of elevated urine L-2-hydroxyglutaric acid.
T2/FLAIR hyperintensity in the U fibers and subcortical WM before deep WM
T2/FLAIR hyperintensity in the globus pallidi
MRS: Nonspecific; normal or mild reduction in NAA

Autosomal recessive; lysosomal disorder; decreased arylsulfatase A or cofactor prevents hydrolysis of sulfatides
Name comes from the deposition of metachromatic staining material (sulfatides) in the white matter
Increased urinary sulfatides is used for diagnosis
Pathology of the brain demonstrates demyelination of affected areas, astrocyte proliferation, gliosis, and absence of inflammation. Peripheral nerves can demonstrate segmental demyelination
Late infantile: Most common (40%) with onset around age 2 and steady progression over 4 years, difficulty walking, hypotonia, progressive polyneuropathy, cerebellar ataxia, nystagmus, and flaccid paresis, leading to spasticity, blindness, and death after 5 years from onset
Juvenile: Onset age 5 to 7 with steady progressive decline in school, language, coordination, and emotional and behavioral disturbances, leading to epilepsy in 50%, quadriplegia, dementia, and death 5 to 10 years from onset
Adult: Onset between age 16 and 30 years; begins with emotional, behavioral, and psychiatric symptoms progressing to spastic paresis, extrapyramidal symptoms, and then to vegetative state with course lasting 15 years
Symmetric deep white matter T2W hyperintensity; subcortical WM later in disease
Stripes of unaffected WM result in “tigroid” or “leopard skin” pattern
Cauda equina can demonstrate enhancement
MRS: Nonspecific; ↑ myoI, ↓ NAA
Differential Diagnosis: Tigroid pattern can also be seen with Krabbe disease, Pelizaeus-Merzbacher, and Cockayne syndrome


Also known as globoid cell leukodystrophy; autosomal recessive; deficiency of lysosomal enzyme galactocerebrosidase → accumulation of cerebroside leading to transformation of phagocytic cells into globoid cells and accumulation of galactosyl sphingosine (psychosine), which leads to apoptosis in oligodendrocytes and loss of myelination. Cerebroside is almost exclusively found in oligodendrocytes, Schwann cells, and myelin. Process of myelination corresponds to rises in galactocerebrosidase activity in normal brains.
Pathology demonstrates diffuse demyelination, diffuse fibrillary gliosis, and accumulation of globoid cells; peripheral nervous system demonstrates demyelination and variable axonal degeneration
Variable time of onset and progression.
Early infantile/classic form is most common with normal first few months of life followed by symptom onset at 1 to 6 months in three stages; stage 1 demonstrating hyperirritability, noise and light sensitivity, excessive startle response, febrile episodes without infection, hypertonia; stage 2 occurring within 2 to 4 months from onset, demonstrating rapid and severe motor and mental deterioration, opisthotonus, hypertonic limb flexion, frequent fevers and sweats, lung infections, myoclonic jerks, seizures, vision failure, and optic atrophy; stage 3 vegetative state with decerebrate posture, blindness, and absent voluntary movements; death occurs between 5 months to 3 years of age
Less common are neonatal onset, late-infantile, juvenile, and adolescent onset.
Stem cell transplantation is performed in late-onset forms.
Early onset form demonstrates high CSF protein with normal cell count.
Stage 1 (early stages) may demonstrate CT hyperdensity in the thalami , and T2/FLAIR hyperintensity in the corona radiata, and less commonly posterior limb of the internal capsule (PLIC), and basal ganglia.
Stage 2 demonstrates abnormal deep white matter T2/FLAIR hyperintensity in the periventricular white matter, corpus callosum, and cerebellar white matter. There is typical sparing of the subcortical U fibers. A “tigroid” pattern similar to metachromatic leukodystrophy can be seen in the deep white matter. Brainstem and cerebellar abnormalities often precede the supratentorial white matter findings. Reduced diffusion can be seen in the white matter in early stages of the disease.
Stage 3 demonstrates diffuse atrophy; optic nerve enlargement due to high number of globoid cells.
Adults may exhibit changes limited to the corticospinal tracts; subtle enhancement can occasionally be detected at the interface of normal and abnormal white matter.
MRS: Nonspecific; ↑ Cho and myoI, ↓ NAA, and abnormal lactate

Also known as childhood ataxia with central nervous system hypomyelination
Autosomal recessive; defective eukaryotic translation initiation factor eIF2B
Histopathology demonstrates gelatinous, cystic and cavitary cerebral white matter with myelin pallor, vacuoles, cyst formation, and rarely active demyelination; no significant inflammation
Age of onset typically 2 to 6 years; chronic progressive neurologic deterioration with ataxia, less prominent spasticity, and mild mental decline; superimposed episodes of rapid decline following head trauma or febrile infection with loss of motor function and hypotonia. Epilepsy is frequently seen but uncommonly the predominant feature. Severe clinical variant such as in Cree leukoencephalopathy has onset between 3 and 9 months and death by 2 years of age.
CSF glycine may be elevated, presumably due to excitatory injury.
Treatment is supportive and avoidance of stress conditions.
Confluent T2/FLAIR hyperintensity of the cerebral white matter greatest in the frontal and parietal lobes, which progresses to low FLAIR signal due to high water content then to disappearance of the white matter without internal collapse of the cortex.
Areas of spared white matter include temporal lobes, anterior limbs of the internal capsules, anterior commissure, and cerebellum. Central tegmental tracts often demonstrate abnormal T2W hyperintensity.
MRS: White matter metabolites progressively decrease; cortex maintains a more normal pattern.
 Axial T1W, and (B, C) axial and coronal T2W images demonstrates a pattern of confluent central and peripheral white matter T2W hyperintensity with anterior temporal and superior frontal cyst formation.")
Also known as van der Knaap disease; autosomal recessive
Abnormal MLC1 gene, which encodes a membrane protein express in astrocyte end feet in the perivascular, subependymal, and subpial regions. The protein function remains unknown.
No laboratory abnormalities. Diagnosis by MRI and genetic testing
Pathology demonstrates intramyelin vacuole formation and fibrillary astrogliosis
Macrocephaly in the first year of life, which later parallels normal curve. Delayed and unstable walking is an early sign followed by slow deterioration of motor function, epilepsy, decreasing school performance, dysarthria, developmental delay presenting at age 2 with gradual progression with ataxia and dysarthria between ages 8 and 12.
No treatment currently exists.
Absent myelin in subcortical white matter (WM) and less involvement of deep WM, callosum, cerebellar WM and occipital lobes
Subcortical cysts typically in the anterior temporal, frontal, and parietal lobes
MRS: Nonspecific; ↓ NAA, ↑ myoI
Differential Diagnosis: Anterior temporal subcortical cyst can also occur with utero CMV infection although head size should be small or normal rather than macrocephalic
Become a Clinical Tree membership for Full access and enjoy Unlimited articles
If you are a member. Log in here
