Physical Address
304 North Cardinal St.
Dorchester Center, MA 02124

A fundamental understanding of the basis and clinical significance of standard laboratory tests in hematology and associated peripheral blood smear findings is essential for analysis and interpretation of certain chemistry test results. The overlap between hematology and chemistry is also an important aspect in most chemistry and hematology laboratories. Rigorous quality control ensuring accuracy and precision applies to both. These inter-relationships are bidirectional; perturbations of blood chemistry can influence hematologic measurements, and conversely, hematologic abnormalities may affect analyte determinations in the clinical chemistry laboratory.
This chapter describes the basic concepts and definitions in hematology, specifically looking at metric data on red blood cell parameters generated in the automated complete blood count and the most common peripheral blood smear red blood cell findings, with particular focus on the overlap of certain hematology and chemistry tests. Perturbations of numerous blood analytes and substances and abnormal hematologic conditions can introduce spurious results in various output measurements in the clinical laboratory, especially within hematology and chemistry domains. Certain substances and conditions can lead to false increase or false decrease in various test results, and, if not corrected or noticed, they may lead or contribute to misleading information with adverse patient outcomes. An awareness of such substances and conditions in patient management and in the scope of accurate laboratory test usage will ultimately enhance patient care and minimize adverse effects and unnecessary or inappropriate treatments.
Just as the automated chemistry analyzer represents the backbone instrument used in the clinical chemistry laboratory that provides essential information covering a broad swath of clinical decision making, so the automated blood counting instrument is the engine that drives and informs most decisions that emanate from the laboratory hematology section of a modern clinical laboratory.
Although widely diverse in their design and purpose—blood cell counters focus on the formed elements of the blood, whereas chemistry analyzers are concerned largely with the composition of the plasma—the functionality and the integrity of the data generated by both of these two mainstay instruments have important and sometimes critical intersections. Aberrations in blood chemistry composition can substantially affect the results generated by blood counting instruments, and abnormalities that arise in the formed elements of the blood that are the feature of hematologic disorders can be associated with or lead to changes in blood chemistry composition that are reflected in real or spurious abnormalities in clinical chemistry values.
The history of blood counting and blood counting instruments is related to the advancements of compound microscopes, which were invented in the Netherlands in the 1600s. After the invention of these instruments, microscopy-based cellular analysis was started in the Netherlands during the 1700s by pioneers such as von Leeuwenhoek. Thereafter, Paul Ehrlich (the “father of hematology”) was able to describe many of the blood cell elements. From there, Malassez and others were able to use instruments such as the hemocytometer in reporting cell counts. Neubauer, by the incorporation of ruled squares, refined this technique for use in manual enumeration of cells. In the 20th century, with the aid of centrifugation, it became possible to quantify several fractions of whole blood. Later, in the 20th century, Coulter’s concept of aperture impedance revolutionized modern hematology and gave rise to the automated hematology era. In the Coulter method, blood cells are suspended in an electric field; using the cells’ inherent conductance potential allows for their separation based on their electric impulse (proportional to their cell volume) and their enumeration through basic principles of particle counting. Soon after, the advent of multiparameter cell analyzers allowed for the automated counting of the cellular elements of blood. Modern hematology analyzers incorporate many of these known aspects in delivering what we know today as the complete blood count (CBC). The interesting history of development of automated blood counters is reviewed elsewhere. Automated blood counting has now extended into the point-of-care testing space with at least one platform being approved by the US Food and Drug Administration as a clinical laboratory improvement amendment waived device (see Chapter 30 ). For detailed discussion on automated hematology, please refer to Chapter 74 .
Certain red blood cell (RBC) morphologic findings may be related to an underlying disorder. The disorder may be hematologic but frequently is not. Such findings are generally not particularly specific and are rarely pathognomonic (a noteworthy exception being the characteristic elongated, scythe-like erythrocytes seen in sickle cell disease). Morphologic RBC abnormalities always should be evaluated both by comparison with normal RBC morphology and in the context of other laboratory and clinical findings. Hence, a solid foundation of what constitutes normal is essential for the recognition of abnormal variations.
Normal RBC populations are normocytic (with a mean cell volume [MCV] of 80 to 100 fL) and with minimal variation in size (normal red cell distribution width [RDW] <14.5%, the coefficient of variation or standard deviation of the RBC volume distribution), and shape. The RBCs are normochromic (mean corpuscular hemoglobin concentration [MCHC] between 31 and 36%). The mean corpuscular hemoglobin (MCH) provides a measure of average per cell RBC hemoglobin content, but also is a function of RBC size (MCH increases proportionately with MCV). It is important to keep in mind that morphologic evaluation of RBCs by conventional light microscopy suffers from the limitation of being two dimensional. Depth cannot be perceived, and size can be estimated only from perceived diameter, which imposes a log order of magnitude restriction on the estimate of cell volume.
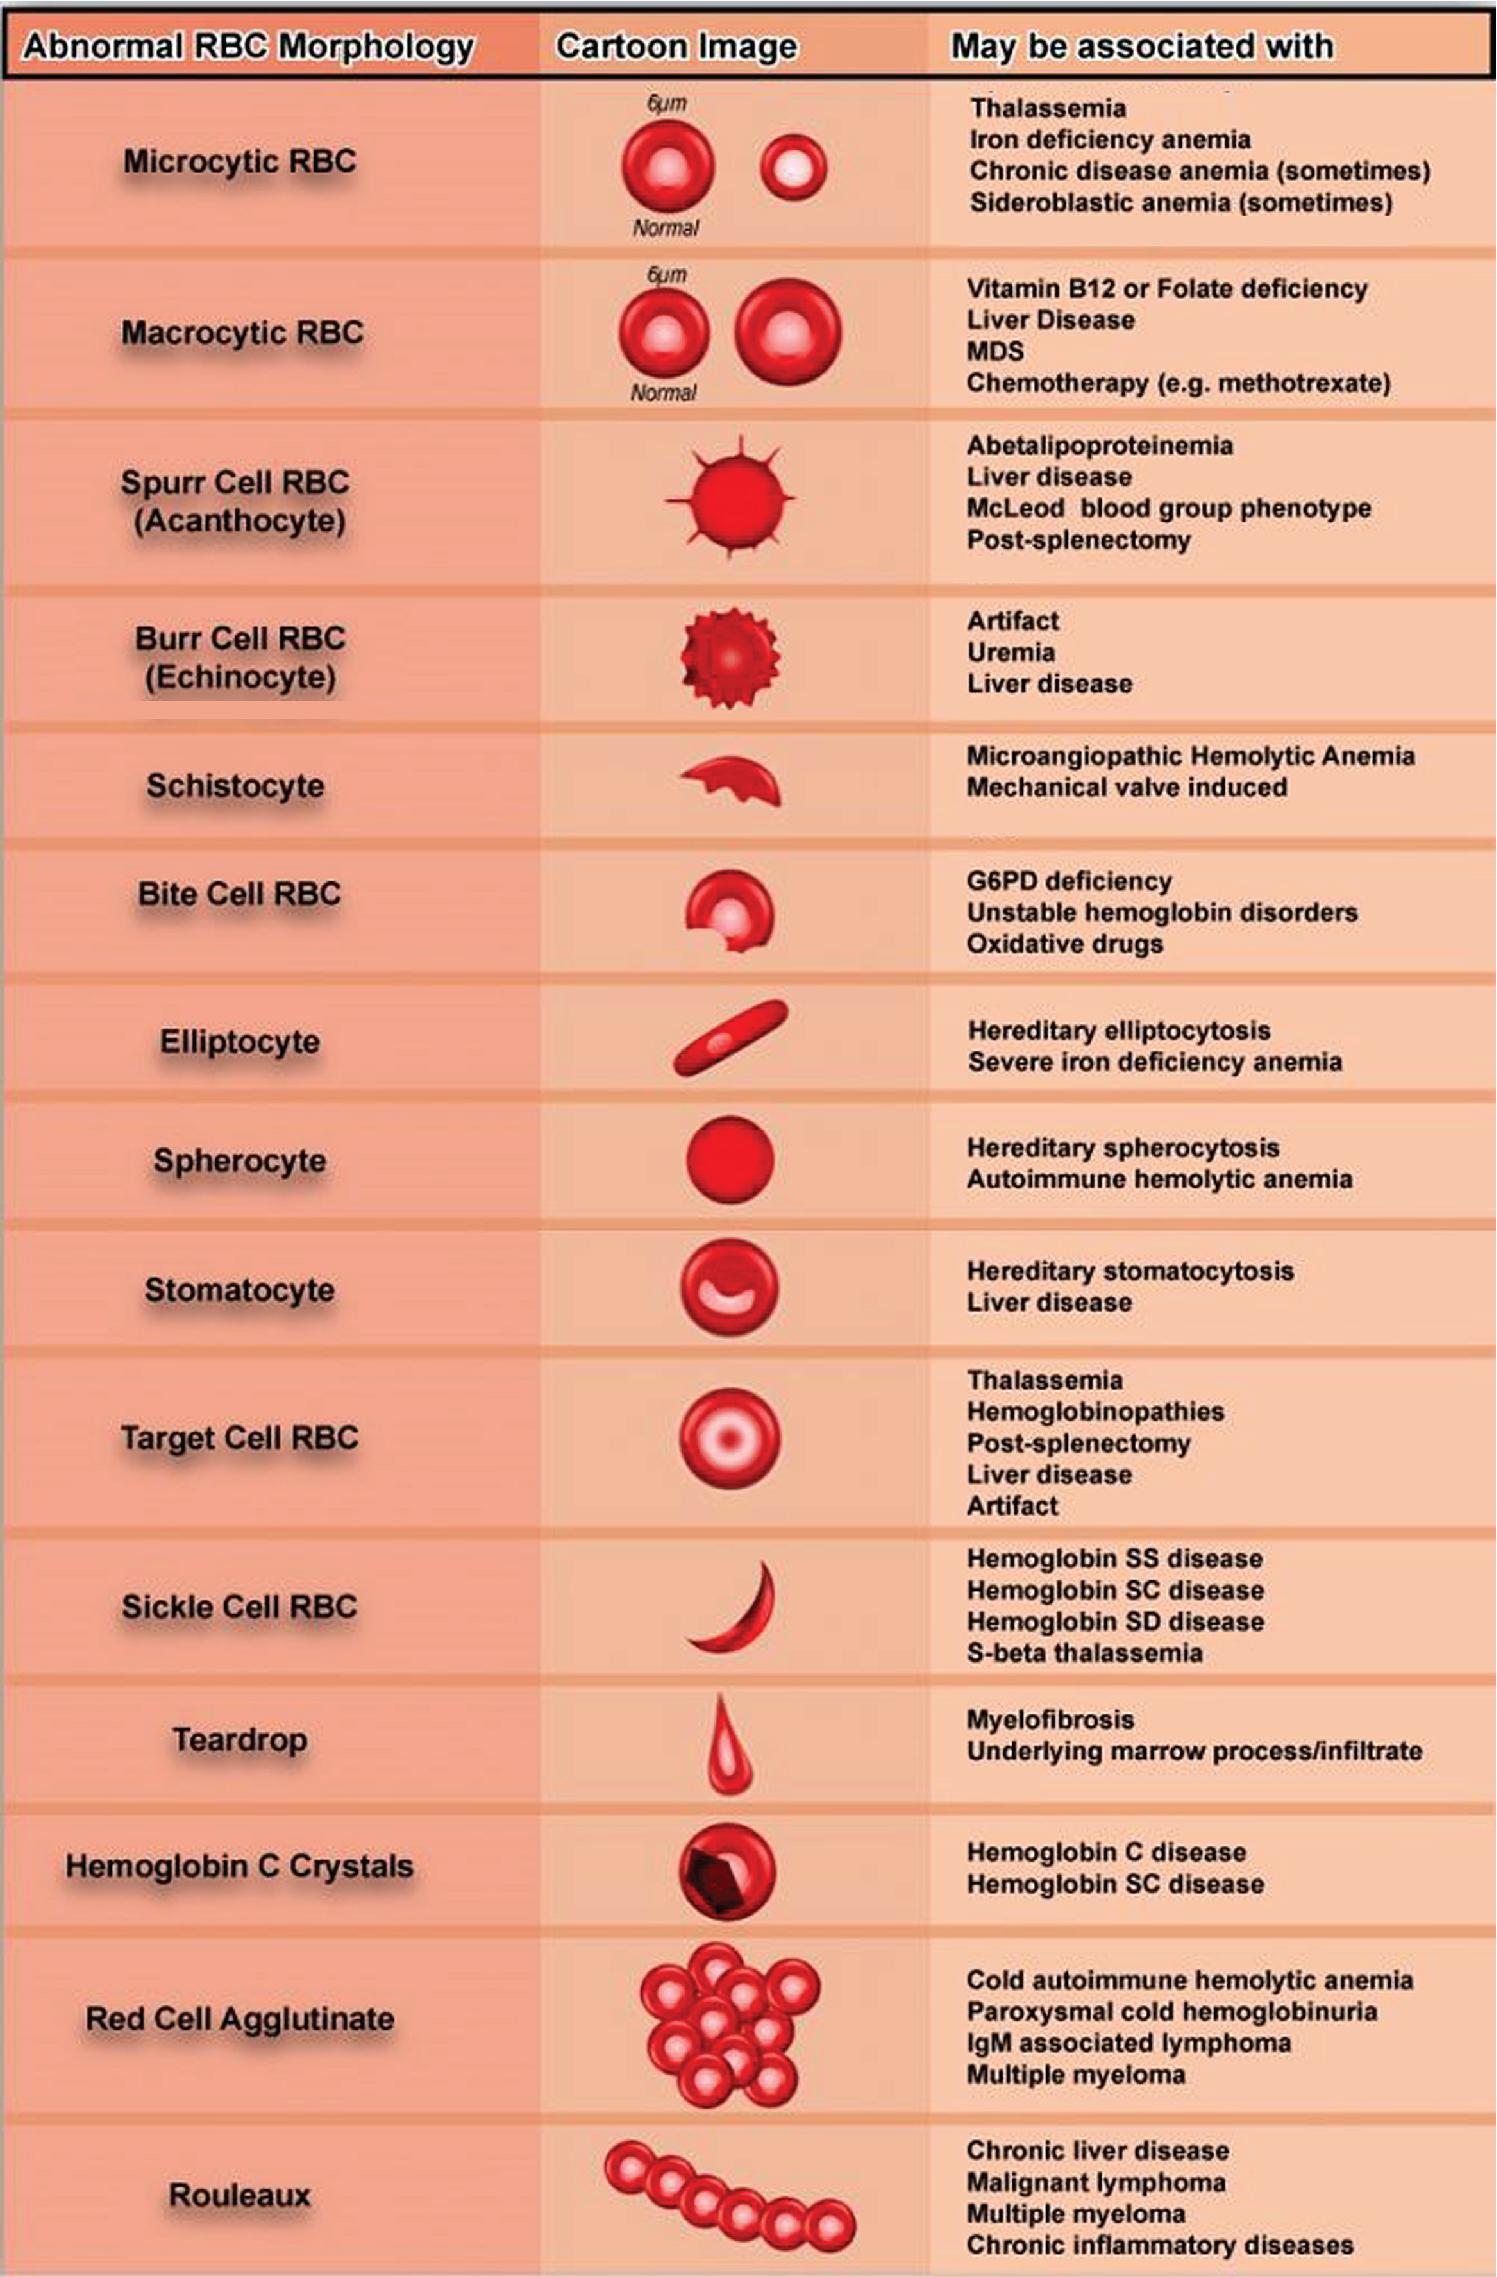
The principal features of RBC morphology are illustrated in Fig. 76.1 . Variations in RBC morphology are regularly used as part of a diagnostic work-up. Some of the more common variations in morphology are summarized in Table 76.1 . They include microcytic RBCs (MCV < 80 fL), macrocytic RBCs (MCV > 100 fL), acanthocytes (also known as spur cells because of their vague resemblance to the spurs on cowboy boots), echinocytes (burr cells), schistocytes (fragmented RBCs), bite cells (degmacytes), elliptocytes, spherocytes, stomatocytes, target cells, sickle cells (drepanocytes), teardrop cells (dacrocytes), hemoglobin (Hb) C crystals, RBC agglutination, and rouleaux RBCs. These variations along with their diagnostic significance and the conditions that they may be associated with are further described in the following section.

Microcytic RBCs ( Fig. 76.2 ) are usually less than 6 µm in diameter and are associated with a decrease in MCV (typically, MCV of <80 fL). Typically, microcytic RBCs in the setting of anemia also display increased central pallor with only a thin rim of cytoplasm. It should be noted that microcytic RBCs with no central pallor are mostly microspherocytes; these are typically not associated with a microcytic anemia and are mainly associated with certain hemolytic or hereditary processes that will be discussed in the section on spherocytes. The presence of microcytic RBCs is mostly due to underproduction of Hb, in most cases secondary to iron deficiency or thalassemia (see Chapters 40 and 77 ). However, the differential diagnosis for microcytic anemia is not confined to only iron deficiency or thalassemia. Microcytic anemia has also been reported in association with iron utilization problems as seen in pyridoxine (vitamin B 6 ) deficiency, and in patients treated with drugs that affect vitamin B 6 metabolism and usage (e.g., tuberculosis patients who are being treated with isoniazid) (see Chapters 39 ). However the primary causes of microcytic anemia are iron deficiency, thalassemia, anemia of inflammation previously referred to as the anemia of chronic disease, and both inherited and some acquired causes of sideroblastic anemias such as X-linked congenital sideroblastic anemia and lead poisoning (see Chapter 44 ). Notably, the microcytic RBCs in patients with β-thalassemia are usually smaller (noted by their lower MCV) than those seen in iron deficiency for the same degree of anemia. Thus whereas the Hb concentration in iron deficiency is markedly decreased (accompanied also by the hypochromasia that is typically seen in iron-deficient RBCs), in β-thalassemia the Hb concentration is relatively preserved. Additionally, because of the relative homogeneity of the RBC population in thalassemia, the RDW, a measure of the size distribution of the RBC population, is generally lower than in iron deficiency for a given degree of anemia. Several discriminant functions have been developed to exploit these quantitative differences and enable easy distinction between thalassemia and iron deficiency. Appropriate laboratory testing can distinguish the specific underlying cause (see section on anemia classification).
.")
Microcytic RBCs are smaller than the normocytic RBCs, with an MCV less than 80 fL.
Causes for microcytic anemia include iron deficiency, thalassemia, certain sideroblastic anemias such as lead poisoning, some anemias of chronic disease or inflammation, and rare cases of vitamin B 6 (pyridoxine) deficiency.
Microcytic RBCs should be distinguished from normocytic RBCs and spherocytes.
Spherocytes lack a central pallor, whereas the RBCs in most microcytic anemias contain a more prominent area of central pallor.
Macrocytic RBCs ( Fig. 76.3 ) are characterized as cells that are larger than the average RBCs (typically >8 µm diameter). When increased in number, these cells will lead to an increase in patient MCV (MCV >100 fL). Macrocytic anemias may be either megaloblastic (secondary to impaired DNA synthesis) or non-megaloblastic (normal DNA synthesis). Disorders with a background of macrocytic RBCs are predominantly confined to vitamin B 12 and folate deficiencies (these are megaloblastic), myelodysplastic syndrome (sometimes megaloblastic), liver disease (caused by an imbalance of lipids in the red cell membrane which leads to excess RBC membrane due to defective cholesterol esterification), hypothyroidism (occasionally), after splenectomy, certain infections (e.g., malaria caused by Plasmodium ovale ), in some cases of aplastic anemia, as a physiologic change during pregnancy, and in association with marked reticulocytosis that is typically seen in patients with an underlying hemolytic process or blood loss (young red cells being almost twice as large as mature RBCs). Macrocytic anemia (in some cases associated with megaloblastic RBC precursors) also can occur with the use of certain drugs. , These include dihydrofolate reductase inhibitors (e.g., methotrexate) and other antifolate drugs; drugs that interfere with folate absorption or metabolism, such as anticonvulsants; oral contraceptives; and antimetabolites that inhibit deoxyribonucleotide synthesis.
.")
The genuinely macrocytic RBC should be distinguished from those with similar appearance (e.g., polychromatophilic RBC). Polychromatophilic RBCs are immature RBCs (also known as reticulocytes when stained with a supravital dye such as New Methylene Blue) that are larger than the average normal RBC and have an increased amount of RNA, which gives them their light grayish-blue cytoplasm (unlike mature RBCs, which have a pink-orange cytoplasm) on blood smears stained with conventional Wright-Giemsa dyes.
Macrocytic RBCs are larger than the normocytic RBCs, with an MCV greater than 100 fL.
Most common causes for macrocytic anemia include vitamin B 12 or folate deficiency, certain drugs (notably folate antagonists like methotrexate), liver disease, myelodysplastic syndrome, and marked reticulocytosis.
They may resemble normocytic RBCs, polychromatophilic RBCs, and sometimes ovalocytes.
Macrocytic anemias may be megaloblastic (secondary to impaired DNA synthesis such as in vitamin B 12 or folate deficiency) or non-megaloblastic (not secondary to an impaired DNA synthesis such as in liver disease).
Megaloblastic anemias typically have the characteristic megaloblastic erythroid precursors in the bone marrow; these are large, immature-appearing erythroid precursors. The megaloblastic changes, which consist of asynchronous nuclear and cytoplasmic development, also may involve other hematopoietic cell lines such as the granulocytic precursors and megakaryocytes.
Spherocytes ( Fig. 76.4 ) are spherically shaped RBCs with no central pallor and a bronzed coloration caused by the increased degree of hemoglobinization. Two mechanisms can lead to the formation of spherocytes. The first is autoimmune hemolytic anemia which is an autoimmune mediated process, that involves uptake of antibody-coated cells by Fc receptors on splenic macrophages leading to loss of RBC membrane and the second is hereditary spherocytosis in which the shape change is mainly related to a defect in one or more of several RBC membrane cytoskeletal protein defects (such as spectrin, ankyrin, band 3, and protein 4.1).
.")
Although spherocytes do not typically predominate in the RBC population, the presence of increased numbers of large reticulocytes, which often accompanies spherocyte formation, tends to offset the presence of the smaller microspherocytes. Consequently, the MCV is rarely in the microcytic range, although the RDW is usually markedly increased. Many spherocytes form through the removal of the RBC membrane in the spleen. This ultimately results in a relative decrease in the ratio of surface area to volume in these cells. These cells are more rigid than normal deformable biconcave RBCs and are not able to traverse the smaller vessels. Hence, most are ultimately removed from the circulation by the spleen, giving rise to their shortened lifespan (lifespan may be reduced to 10 to 20 days compared with the normal of 120 days). Hemolysis associated with spherocytes is therefore extravascular. Spherocytes have a decreased membrane-to-volume ratio and as a result have increased osmotic fragility (which refers to the propensity of the RBCs to lyse under osmotic stress).
The two processes leading to spherocytosis may give rise to similar appearances on a peripheral blood smear, but, owing to their underlying mechanistic differences, there may be variations in certain RBC characteristics. Examples include the MCV which is usually normal in hereditary spherocytosis but may be increased in autoimmune hemolytic anemia when there is brisk hemolysis associated with marked reticulocytosis. Also, there is a difference in MCHC, which is frequently increased in hereditary spherocytosis but is typically normal in autoimmune hemolytic anemia). The increase in MCHC seen in some blood counts of hereditary spherocytosis is related to the defect in certain RBC membrane or membrane-associated proteins, as described earlier. , The defect in these RBC membrane proteins may sometimes lead to an altered function of the Na + ,K + -ATPase pump in the RBCs that leads ultimately to a change in osmolarity, a decrease in RBC aqueous volume, and a relative increase in the concentration of RBC Hb that may be reflected in increase of the MCHC. Appropriate laboratory testing can distinguish the specific underlying cause (see section on anemia classification). Microspherocytes also can arise in severe burns, as a result of membrane damage resulting from temperatures that exceed the phase transition temperature of the RBC membrane.
Target cells (codocytes) ( Fig. 76.5 ) are target-like RBCs that have a darker hemoglobinized center (partially replacing the central pallor). These RBCs are the result of an increase in the RBC’s ratio of membrane to cytoplasmic volume. This may be secondary to increased membrane deposition (as seen in liver disease) or reduced cytoplasmic volume (as seen in quantitative deficiency of Hb synthesis that occurs in thalassemia). Because of membrane redundancy, target cells are more resistant to osmotic cell lysis, which is reflected by their behavior in the osmotic fragility test (the relative increase in the RBC membrane may accommodate more fluid accumulation and make them less prone to lysis in hypotonic solution). Prominent target cells noted on a peripheral blood smear are suggestive of thalassemia, certain hemoglobinopathies (e.g., HbE, HbC, or sickle cell Hb disease), liver disease, and postsplenectomy states and occasionally may be due to a drying artifact when preparing the slide. Appropriate laboratory testing can distinguish the specific underlying cause (see section on anemia classification).
.")
Schistocytes (RBC fragments, “helmet” cells) are damaged RBCs that are the result of RBC fragmentation (mostly secondary to an intravascular event) ( Fig. 76.6 ). The fragmentation is random. Because the RBC membrane has the propensity to spontaneously reseal, fragmentation gives rise to fragmented RBCs and fragments of variable size and shape (typically with no pallor). An increase in the number of schistocytes is often associated with a microangiopathic hemolytic anemia (MAHA). This type of anemia may be due to various disorders, including but not limited to disseminated intravascular coagulation (DIC), thrombotic thrombocytopenic purpura (TTP), and hemolytic uremic syndrome (HUS). The mechanism of formation of the schistocytes in these disorders depends on the underlying pathogenesis of each disease. , In DIC, RBCs collide with and become impaled on fibrin deposits that arise as a result of intravascular coagulation. However, in TTP the absence or reduced activity of ADAMTS13 (a normally occurring von Willebrand factor [VWF] cleaving protease) leads to increased amounts of larger VW antigen multimers whose interactions with circulating platelets causes clumping with subsequent damage to RBCs which is believed to result in RBC fragmentation. For additional discussion on VWF, refer to Chapter 80 .
.")
Schistocytes are usually smaller than normal RBCs with variable sizes and shapes.
They usually lack any central pallor.
They may resemble bite cells, sickle cells, and spur cells.
Increased schistocytes are typically the result of intravascular hemolytic processes such as in microangiopathic hemolytic anemias (e.g., DIC, TTP, and HUS), mechanical valve–induced, and malignant hypertension.
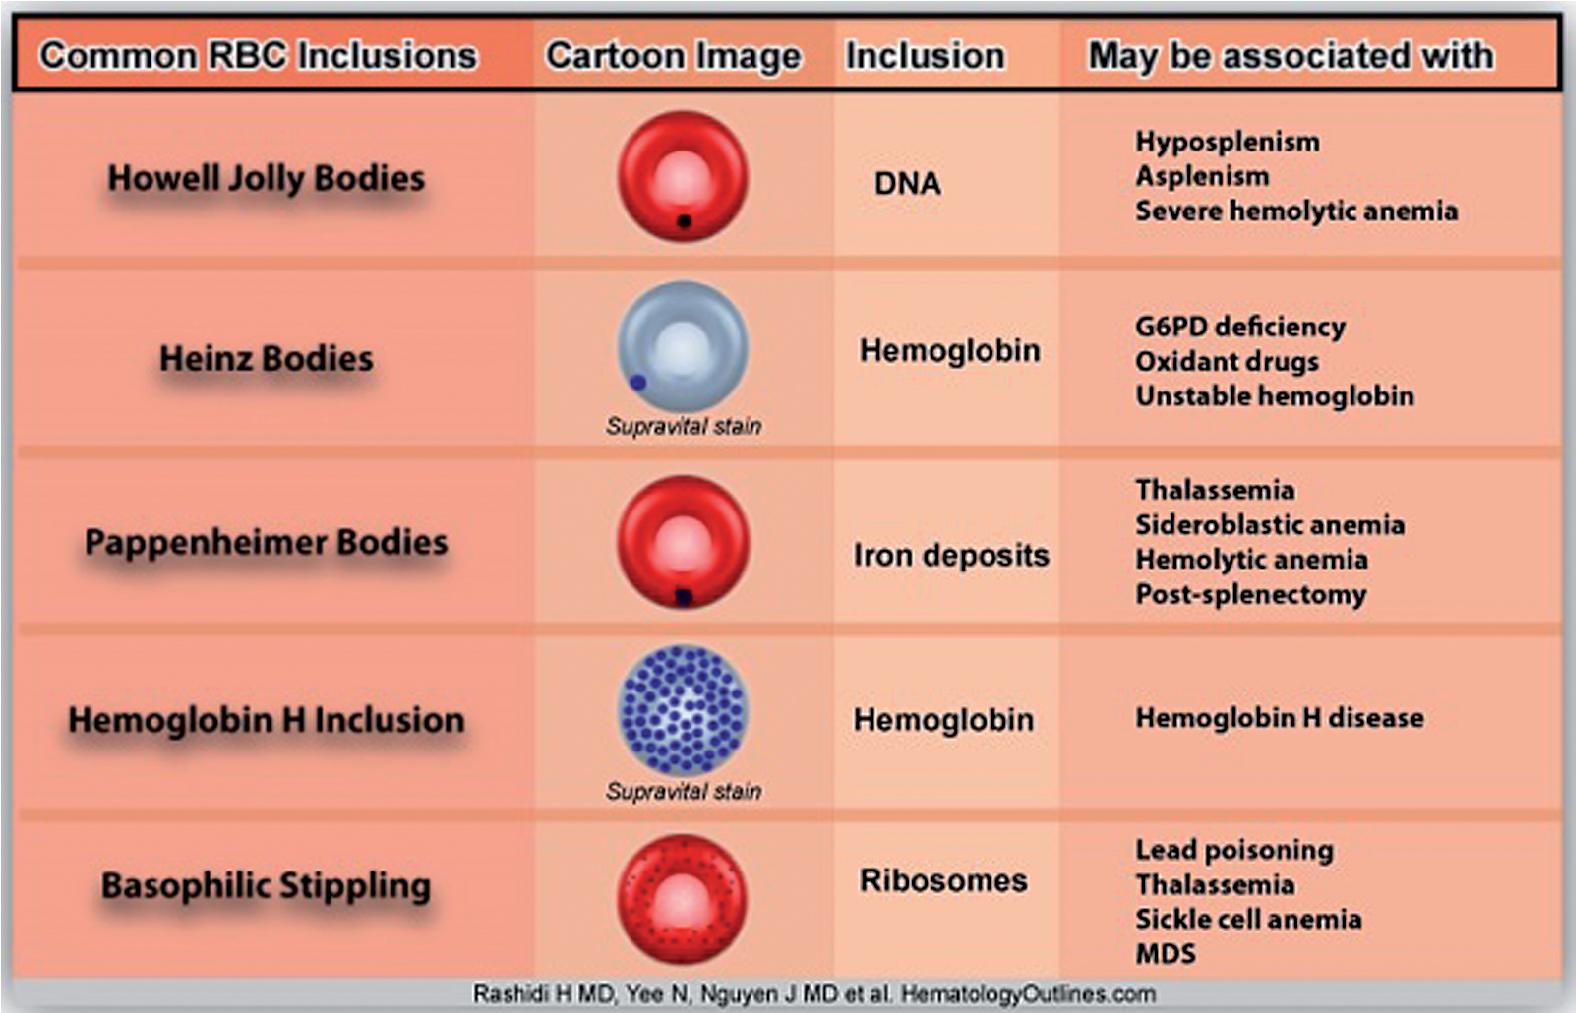
Basophilic stippling refers to the presence in RBCs of inclusions of aggregated damaged ribosomes ( Fig. 76.7 ). RBC inclusions may occur secondarily to a variety of conditions and elements. The most common inclusions (noninfectious) are summarized in Table 76.2 and include Howell-Jolly bodies (DNA-containing nuclear remnants), Heinz bodies (oxidized Hb inclusions), Pappenheimer bodies (degenerating cellular remnants containing Perl-staining hemosiderin-like nonheme iron), and Hb H (abnormal Hb inclusions consisting of abnormal aggregates of redundant β chains tetramers that occur in α-thalassemia). Increased number of RBCs with fine basophilic stippling is not a specific finding and can occur with a number of underlying disorders (e.g., thalassemias, sickle cell anemia, megaloblastic anemia, myelodysplastic syndrome, and after splenectomy). On the other hand, coarse basophilic stippling is suggestive of lead poisoning (see Chapter 44 ) but may also occur in certain rare inherited disorders such as pyrimidine-5′ nucleotidase deficiency. This is an autosomal recessive disorder that ultimately leads to the accumulation of pyrimidine nucleotides within RBCs. Interestingly, lead inhibits the 5′-pyrimidine nucleotidase enzyme which explains the mechanism of this heavy metal toxicity.
.")
Echinocytes (or burr cells) are RBCs with relatively evenly distributed small membrane projections ( Fig. 76.8 ). These cells maintain their central pallor (unlike acanthocytes, which generally lack central pallor). The most common cause of burr cells is artifactual, resulting from either improperly prepared smears (slow drying, aged, or thick smears) or an increase in the pH on the surface of the glass slide. Less often, an increased number of burr cells may be associated with azotemia (secondary to underlying renal disease), dehydration, hypothyroidism, and severe burns. Echinocytes are also seen after splenectomy and in patients with pyruvate kinase deficiency, an RBC enzyme defect (see Chapter 78 ).
.")
Acanthocytes (spur cells) are RBCs with irregular sharp membrane projections that gives them their spur-shaped appearance ( Fig. 76.9 ). Unlike burr cells, spur cells generally lack a zone of central pallor. Increased numbers may be secondary to liver disease or abetalipoproteinemia, malabsorptive states, or after splenectomy. They also may be seen in certain blood phenotypes such as McLeod blood group or Lu blood group. Rare forms also may be seen in various disorders, including certain hematologic neoplasms, MAHAs, autoimmune hemolytic anemias, certain endocrine disorders (e.g., hypothyroidism), and malnutrition in children.
.")
Stomatocytes are bowl-shaped RBCs with a small concavity in the center that gives the cell a mouth-shaped appearance. Stomatocytes may be seen in hereditary stomatocytosis, a defect in various RBC membrane proteins such as band 3. Stomatocytes may also be seen in liver disease.
Normal RBCs are typically separated from one another by an electrostatic charge and do not aggregate. The relative charge repulsion between the RBCs, known as the zeta potential, prevents the cells from sticking to one another ( Fig. 76.10 ). Disorders or physiologic conditions that decrease this zeta potential increase the likelihood of cellular aggregation. The two most common RBC aggregates are rouleaux and RBC clumping (agglutination [see below]) (see Fig. 76.10 ).
.")
Rouleaux is commonly seen in hyperglobulinemia involving immunoglobulin G (IgG). Rouleaux characteristically have a “stack of coins” appearance and are usually the result of an underlying increased (non-IgM) immunoglobulin concentration (typically IgG and sometimes IgA), as occur in either polyclonal increases caused by infection or inflammation or monoclonal disorders such as plasma cell myeloma (multiple myeloma) and monoclonal gammopathy of unknown significance. Rouleaux formation is often associated with an increased erythrocyte sedimentation rate.
In plasma cell myeloma and related conditions, a clonal population of plasma cells secretes a clonal immunoglobulin, often in large amounts. The immunoglobulins are positively charged (compared with other plasma proteins such as albumin), and their presence leads to a decrease in the zeta potential, ultimately inducing the formation of RBC aggregates (either rouleaux or, in the presence of IgM, RBC agglutinates). Certain other conditions such as the presence of cold agglutinins also will induce RBC agglutination and are less likely to form rouleaux. Cold agglutinins are usually IgM (which is pentameric, unlike IgG, which is monomeric) and because of their pentameric antigen binding sites are more likely to induce the formation of RBC agglutinates than rouleaux.
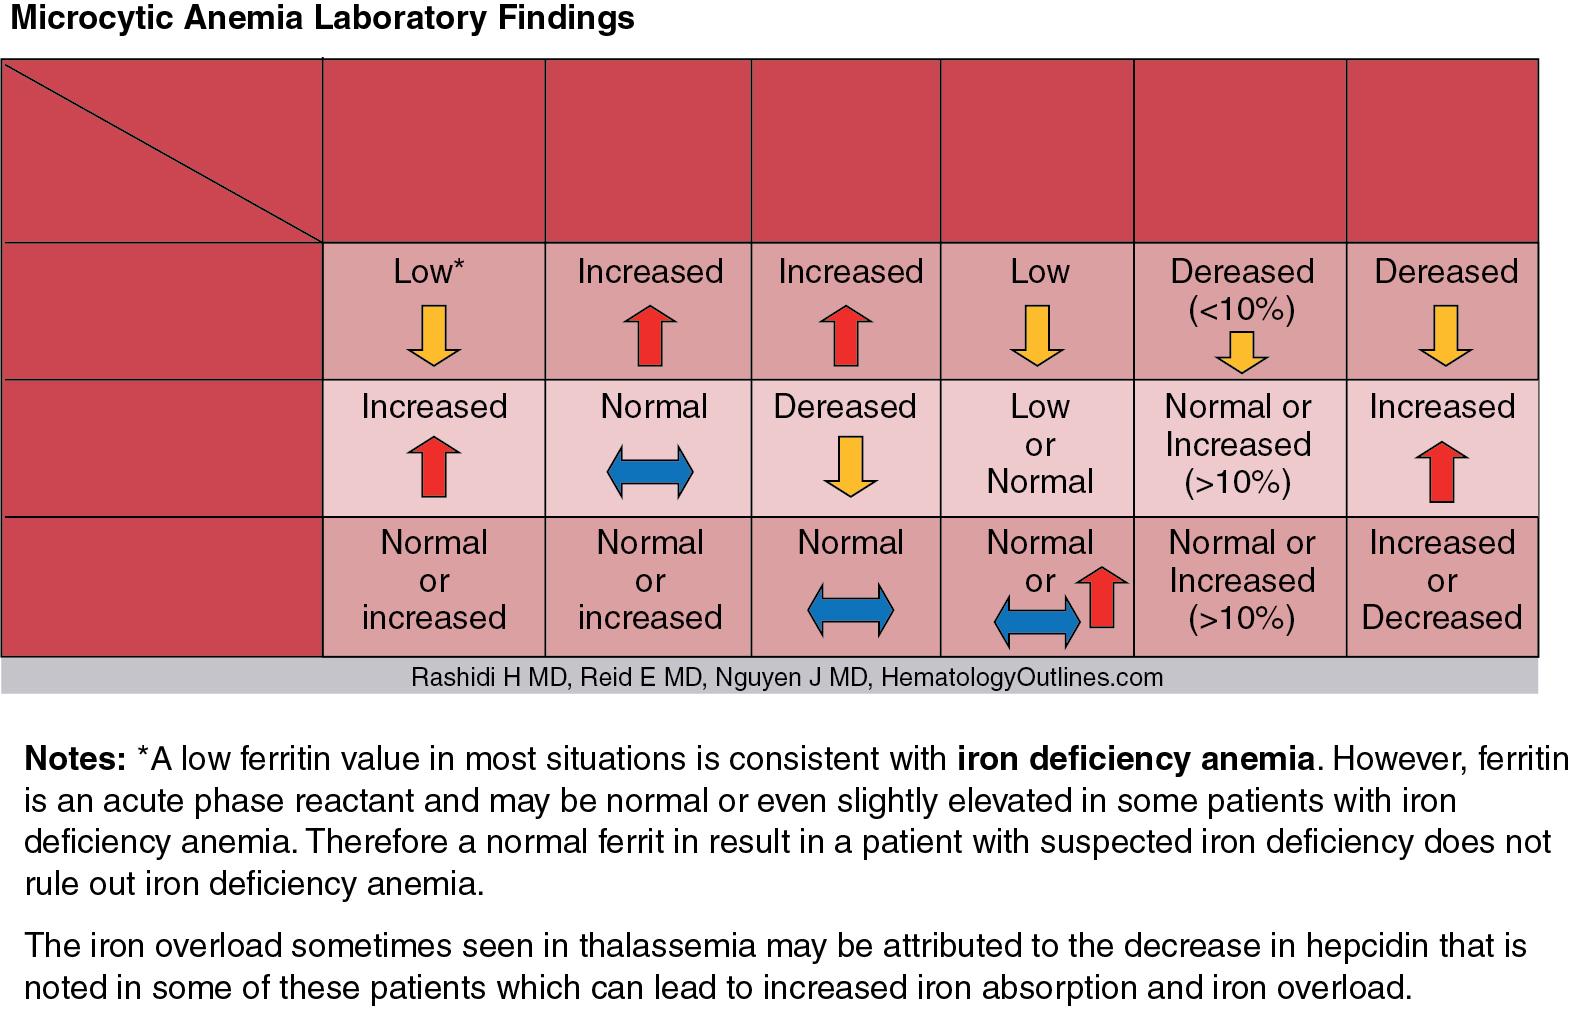
Anemias are conveniently subclassified on the basis of the patient’s RBC MCV value. Using this MCV-based criterion, anemia can be classified as either microcytic (MCV < 80 fL), normocytic (MCV 80 to 100 fL), or macrocytic (MCV > 100 fL). This approach enables work-up of most patients in a logical and systematic manner. The selection of follow-up ancillary laboratory studies is then predominantly based on the most likely differential diagnosis in each category ( Fig. 76.11 ). ,

In microcytic anemias, the differential diagnosis is predominantly confined to iron deficiency anemia, thalassemia, pyridoxine deficiency, and certain sideroblastic anemias (e.g., lead poisoning) and sometimes may be secondary to anemia of inflammation (anemia of chronic disease). Hence, the appropriate follow-up laboratory testing will include iron studies (i.e., serum iron, ferritin, total iron-binding capacity), soluble transferrin receptor, and sometimes hepcidin (where available, see Chapter 40 ) to distinguish iron deficiency anemia from anemia of inflammation and thalassemia, as shown in Table 76.3 . Follow-up hemoglobin analysis by high-pressure liquid chromatography or capillary zone electrophoresis combined with genetic studies also may be needed when thalassemia is suspected (see Chapter 77 ). In some low-resource settings, a therapeutic trial of iron may be used to treat suspected iron deficiency before resorting to more expensive testing. The use of discriminant functions derived from measurements contained in a blood count may assist for discrimination of thalassemia from iron deficiency, as pointed out previously. Note that the diagnostic work-up for thalassemia should include iron studies because certain thalassemias (e.g., β-thalassemia) may be missed in the setting of concomitant iron deficiency (e.g., β-thalassemia patients with concomitant iron deficiency may not show an increase in HbA 2 until the underlying iron deficiency is corrected).
In normocytic anemia, the underlying cause can be further subclassified into either anemia resulting from RBC underproduction (e.g., low erythropoietin [EPO] concentration secondary to EPO underproduction from an underlying renal disease ); anemia of inflammation, which can be correlated with the patient’s known chronic disease and further evaluated by measuring certain laboratory values such as C-reactive protein and hepcidin , ; or anemia caused by premature RBC destruction or loss. The cause of blood loss may be obvious but may require investigation, such as with a fecal occult blood test and/or endoscopy for ruling out gastrointestinal bleeding. Premature RBC destruction can be secondary to an intrinsic defect in the RBC membrane, Hb structure, or glycolytic or other enzymes as in hereditary spherocytosis, sickle cell anemia, or glucose-6-phosphate dehydrogenase (G6PD) deficiency, respectively, or to an extrinsic source such as RBC antibodies, leading to a hemolytic anemia. It is important to recognize that in states of hemolysis, anemia develops only if and when the ability of the bone marrow to compensate for the shortened life span of RBCs is exceeded. Follow-up clinical chemistry laboratory tests, including total and direct bilirubin, lactate dehydrogenase, haptoglobin, hemopexin, plasma and urine Hb, or hemosiderin, are useful to support and further investigate the suspected diagnosis. The direct antiglobulin test is performed to detect the presence of antibodies directed against the RBC membrane.
As an extension to anemia of inflammation, sepsis is a potential cause of anemia and has been associated with alterations in RBC morphology—suggesting RDW and perhaps other RBC indices may be used as a prognostic marker. The performance of RDW as a biomarker in particular during sepsis has shown promise with performance superior to C-reactive protein, and complementary to procalcitonin. Specifically, RDW is significantly higher in nonsurviving sepsis patients versus survivors (17.8 ± 3.4% versus 16.8 ± 2.9%, P = 0.029), with MCV similar between the two populations (86.9 ± 8.1 fL versus 85.1 ± 9.5 fL, P = 0.154). Causes of this sepsis-related phenomenon is attributed to erythropoietic derangements through various mechanisms encountered during critical illness. Increased inflammatory markers such as tumor necrosis factor-α, interleukin 6, interleukin-1β, among others, affect the RBC survival and maturation. This results in an early release of immature, larger RBCs into the circulation and increasing RDW. Pro-inflammatory states also decrease erythropoietin production while also reducing marrow RBC production and decreasing iron bioavailability through the action of hepcidin. Sepsis is also known to decrease erythroid precursor activity in the bone marrow. , Lastly, sepsis-related oxidative stress may also contribute to changes in RDW by decreasing erythrocyte survival and promoting the release of larger young RBCs into circulation.
In contrast, the vast majority of the macrocytic anemias are likely due to either an underlying megaloblastic process (e.g., vitamin B 12 deficiency, folate deficiency, some myelodysplastic syndromes that have a megaloblastic component, and certain drugs such as methotrexate) or a non-megaloblastic disorder (e.g., liver disease, myelodysplastic syndrome, marked reticulocytosis, and hypothyroidism, see earlier discussion).
Multiple substances and hematologic conditions can introduce spurious results in various aspects of laboratory medicine (hematology tests and chemistry or chemistry-related tests) (see Chapter 5 ). These substances and conditions can lead to false increases or decreases in various test results; if not corrected or noticed, they may lead or contribute to erroneous measurements and adverse patient outcomes. Being aware of such substances and/or conditions in patient management is essential in the scope of accurate laboratory test usage and will ultimately enhance patient care and minimize adverse effects and unnecessary treatments. The interface between hematology and chemistry is bidirectional. In the first section of the discussion of this topic, we introduce the conditions or substances that lead to spurious hematologic test results, specifically in CBC. Thereafter, we describe hematologic conditions and substances and events that may lead to spurious chemistry or chemistry-related test results.
Quality control for CBCs (similar to other laboratory tests) is paramount for the achievement of accurate and reliable results. Inaccuracies may adversely affect patient care. Hence, a solid foundation of the various factors that may lead to such aberrancies is an essential part of the operation and protocols of any hematology laboratory. Variables that may lead to spurious CBC results are mostly preanalytical or analytical in origin. The preanalytical variables include (but are not limited to) patient identifiers, the use of appropriate collection tubes, how and when the sample was collected and transported, storage temperatures, and how the sample appears visually before being analyzed. The analytical variables may be related to the instrument (e.g., quality control and calibration issues), physiologic conditions (patient’s age, ethnicity, diurnal variations, altitude, exercise, stress, pregnancy, and smoking), or problems with the sample, including interfering substances that may be present within the sample being analyzed (e.g., clotted sample, hemolysis, platelet clumps, hyperbilirubinemia, hyperlipidemia, cryoglobulinemia, and the presence of toxins or chemotherapeutic agents).
Spurious CBC results are best characterized as those that predominantly affect the platelet count, those that predominantly affect the RBC counts, and those that predominantly affect the white blood cell (WBC) counts. Certain variables that lead to a spurious decrease in the platelet count include the presence of an increased number of giant platelets, ethylenediaminetetraacetic acid (EDTA)-induced platelet aggregation, , and increased platelet satellitosis/satellitism (platelets adherent to the monocyte or neutrophil cell membrane) that is usually surrounding monocytes and neutrophils. Common variables that lead to a spurious increase in the platelet count include the presence of certain RBC inclusions (e.g., Pappenheimer bodies), microorganisms, fragmented RBCs, cryoglobulins, and lipid moieties. For RBCs, some common variables that lead to a spurious decrease include hemolysis and cold agglutinins, while spurious increased RBC/Hb results may be a result of interfering immunoglobulins and very high WBC counts. Some common conditions that may spuriously increase WBC counts include an increased number of unlysed RBCs, certain microorganisms such as fungi, platelet aggregates, cryoproteins, and increased number of nucleated RBCs. A common cause of a spurious decrease in WBC count is the presence of clumped WBCs in the sample. It should be noted that spurious CBC results also may be secondary to certain conditions that affect all cell count parameters (platelets, WBCs, and RBCs). These include diluted samples (e.g., samples contaminated by intravenous fluid), clotted samples, or overfilled tube samples. Hence, it is very important to have an understanding of these conditions and variables when analyzing and ultimately interpreting the CBC results. Evaluation of the concurrent peripheral blood smear in certain cases may help rule out or rule in the possibility of some of the spurious counts (e.g., pseudo-thrombocytopenia secondary to EDTA-induced platelet clumps that may be seen on a peripheral blood smear review).
Here we describe some common substances and conditions that may lead to spurious results within the CBC parameters (e.g., pseudo-increase or pseudo-decrease in certain cell counts such as WBC, RBC, Hb, MCV, and platelets).
Become a Clinical Tree membership for Full access and enjoy Unlimited articles
If you are a member. Log in here