Physical Address
304 North Cardinal St.
Dorchester Center, MA 02124

This is one of the most important chapters of the book because it considers the methods and concepts of evaluating the signs and symptoms involved in diagnostic reasoning. The previous chapters discuss the “science” of medicine by explaining the techniques for interviewing and performing the physical examination. The ability to make the “best” decision in the presence of uncertainty is the “art” of medicine. But there are rules and standards for the practice of this art, and these are the focus of this chapter.
The primary steps in this process involve the following:
Data collection
Data processing
Problem list development
Data collection is the product of the history and the physical examination. These can be augmented with laboratory and other test results such as blood chemistry profiles, complete blood cell counts, bacterial cultures, electrocardiograms, and chest radiographs. The history, which is the most important element of the database, accounts for more than 70% to 75% of the problem list. The physical examination findings contribute an additional 20% to 25% of the database; less than 10% of the database is related to laboratory and other test results.
Data processing is the clustering of data obtained from the history, physical examination, and laboratory and imaging studies. It is rare for patients to have a solitary symptom or sign of a disease. They complain more commonly of multiple symptoms, and the examiner may find several related signs during the physical examination. It is the job of the astute observer to fit as many of these clues together into a meaningful pathophysiologic relationship. This is data processing.
For example, suppose the interviewer obtains a history of dyspnea, cough, earache, and hemoptysis. Dyspnea, cough, and hemoptysis can be grouped together as symptoms suggestive of cardiopulmonary disease. Earache does not fit with the other three symptoms and may be indicative of another problem. For another patient who complains of epigastric burning relieved by eating and whose stool is found to contain blood, this symptom and this sign should be studied together. These data suggest an abnormality of the gastrointestinal tract, possibly peptic ulcer disease. Although patients usually have multiple symptoms or signs from a pathologic condition, they may not always manifest all the symptoms or signs of the disease being considered. For instance, the presence of polyuria and polydipsia in a patient with a family history of diabetes is adequate to raise the suspicion that a lateral rectus muscle palsy may be related to diabetes, even if diabetes has not previously been diagnosed in this patient. In another patient, a 30-pound weight loss, anorexia, jaundice, and a left supraclavicular lymph node are suggestive of gastric carcinoma with liver metastasis to the porta hepatis. This illustrates the concept of data processing multiple symptoms into a single diagnosis. The process has sometimes been likened to the rule of Occam's razor 1
1 Occam's razor is a principle from philosophy, also known as the law of parsimony. It is attributed to a 14th-century Franciscan friar and philosopher William of Ockham. Another way of stating Occam's razor is “when you have two competing theories that make exactly the same predictions, the simpler one is the better.”
: The simplest theory is preferable—in this case, that all the symptoms can be explained by one diagnosis. Although it is a useful rule to keep in mind, it is not always applicable.
Problem list development results in a summary of the physical, mental, social, and personal conditions affecting the patient's health. The problem list may contain an actual diagnosis or only a symptom or sign that cannot be clustered with other bits of data. The date on which each problem developed is noted. This list reflects the clinician's level of understanding of the patient's problems, which should be listed in order of importance. Table 27.1 is an example of a problem list.
| Problem | Date | Resolved |
|---|---|---|
|
12/25/19 | |
|
1/30/18 | 2/15/18 |
|
4/30/15 | 6/3/15 |
|
2010 | |
|
2004 | |
|
6/10/16 | 7/1/16 |
|
11/19 |
The presence of a symptom or sign related to a specific problem is a pertinent positive finding. It is a sign or symptom that might be expected, based upon the chief complaint that the patient admits having. A history of gout and increased uric acid level are pertinent positive findings, for example, in a man suffering from excruciating back pain radiating to his testicle, the man's chief complaint. This patient may be suffering from renal colic secondary to a uric acid kidney stone. The absence of a symptom or sign that, if present, would be suggestive of a diagnosis is a pertinent negative finding. It is a sign or symptom that might be expected, based upon the chief complaint, that the patient denies having. A pertinent negative finding may be just as important as a pertinent positive finding; the fact that a key finding is not present may help rule out a certain diagnosis. For example, the absence of a history of tachycardia or warm intolerance in a woman with weight loss and a tremor makes the existence of hyperthyroidism less likely; the presence of a history of tachycardia or warm intolerance would strengthen the likelihood of hyperthyroidism.
An important consideration in any database is the patient's demographic information: sex, age, ethnicity, and area of residence. A man with a bleeding disorder dating from birth is likely to have hemophilia. A 65-year-old person with exertional chest pain is probably suffering, statistically, from coronary artery disease. A 26-year-old African-American patient with multiple episodes of severe bone pain may be suffering from sickle cell anemia. A person living in the San Joaquin Valley who has pulmonary symptoms may have coccidioidomycosis. This information is often suggestive of a unifying diagnosis, but the absence of a “usual” finding should never totally exclude a diagnosis. Be careful, however, of bias, which will be addressed in Chapter 5 , Mitigating Racism and Bias in Clinical Medicine. Bias is the inclination or prejudice for or against a diagnosis, person, or group, especially in a way to be unfair.
It has been said, “common diseases are common.” This apparently simplistic statement has great merit because it underlines the fact that the observer should not assume an exotic diagnosis if a common one accurately explains the clinical state. In contrast, if a common diagnosis cannot account for all the symptoms, the observer should look for another, less common diagnosis. It is also true that uncommon signs of common diseases are more common than common signs of uncommon diseases.
Finally, a rare disease is not rare for the patient who has the disease. If a patient's symptoms and signs are suggestive of an uncommon condition, that patient may be the 1 in 10,000 who actually has the disease . Nevertheless, statistics based on population groups provide a useful guide in approaching clinical decision making for individual patients.
Decisions in medicine, unfortunately, can rarely be made with 100% certainty. Probability weights the decision. Probability is defined as the chance or likelihood that a proposition is true. Only if the cluster of symptoms, signs, and test results is unequivocal can the clinician be certain of a diagnosis. This does not occur often. How, then, can the clinician make the “best” decision—best in light of current knowledge and research?
Laboratory tests immediately come to mind. But signs and symptoms obtained from the patient's history and physical examination perform the same function as laboratory tests, and the information and results obtained from signs, symptoms, and tests are evaluated in the same way and are subject to the same rules and standards of evidence for diagnostic reasoning. Also, signs and symptoms actually account for more (90%) of the developing problem list than do laboratory test results (<10%).
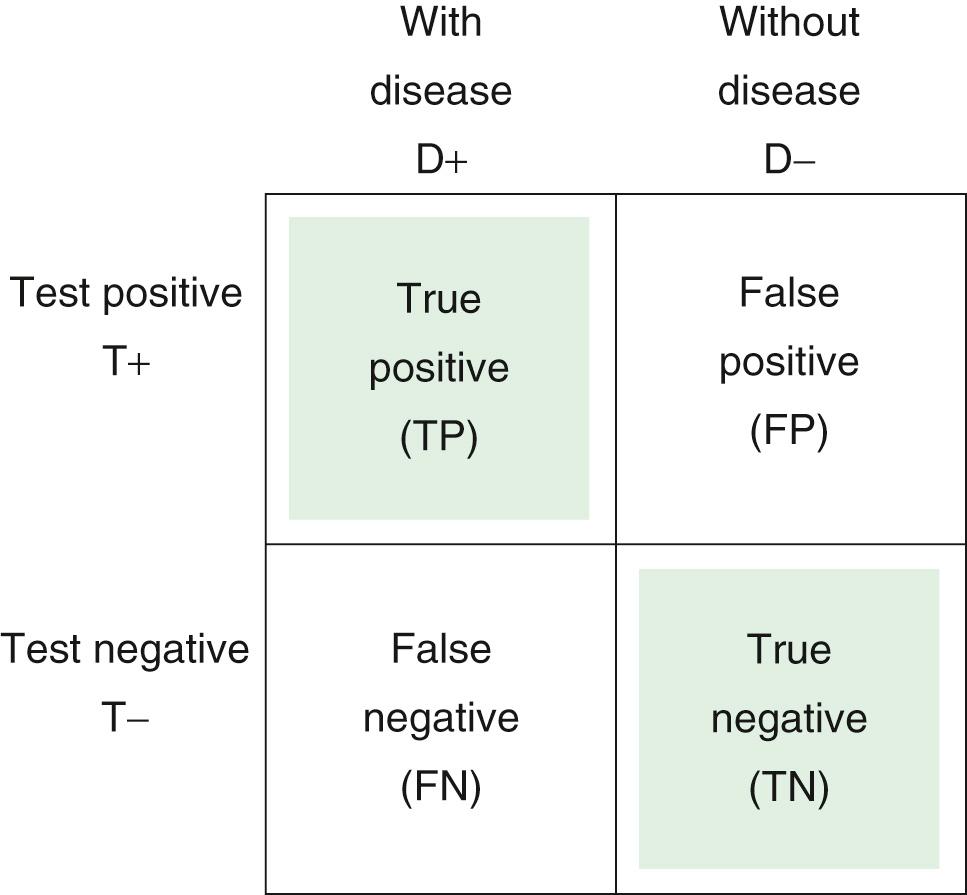
Throughout this text, signs and symptoms have been described often according to their operating characteristics: sensitivity and specificity. These operating characteristics, which apply also to laboratory tests, indicate the usefulness of the sign, symptom, or test to the clinician in making a diagnosis. Sensitivity is sometimes called the true positive (TP) rate, or the percentage of patients who have the disease who test positive on the test. Sensitivity, therefore, is based solely on patients with the disease. Specificity is sometimes called the true negative (TN) rate, or the percentage of patients who do not have the disease who test negative on the test. Specificity, therefore, is based only on individuals without the disease. A false-positive (FP) finding refers to a positive test result in an individual without the disease or condition. Thus a sign, symptom, or test with 90% specificity can correctly identify 90 of 100 normal individuals; findings in the other 10 individuals are FP, and the FP rate is 10%. If a test result or observation is negative in a person with the disease, the result is termed false negative (FN).
The 2 × 2 table is useful for representing the relationship of a test, symptom, or sign to a disease.
D+ indicates the presence of the disease
D− indicates the absence of the disease
T+ is a positive test result, or the presence of a symptom or sign
T− is the absence of a positive test result, or the absence of a symptom or sign.
Each of the cells of the table represents a set of patients. Consider the following 2 × 2 table:
Sensitivity is defined as the number of TP results divided by the number of patients with the disease (i.e., the total of the TP and the FN results):
Specificity is defined as the number of TN results divided by the number of patients without the disease (i.e., the total of FP results and TNs):
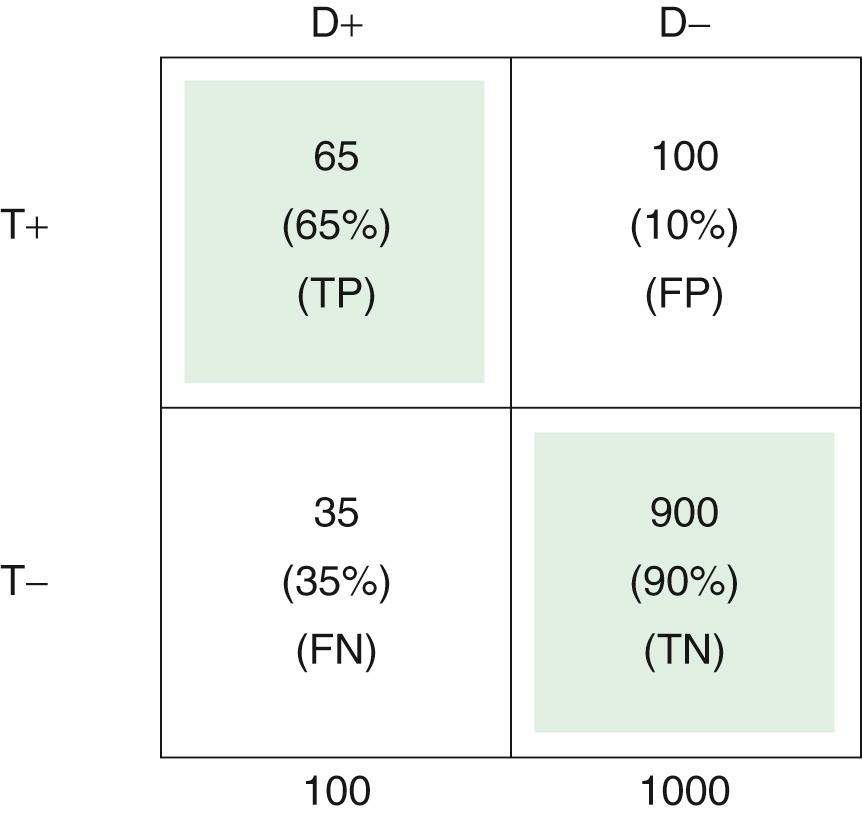
The upper left cell of the 2 × 2 table (TP) indicates that 65 of 100 patients with a certain disease (65%) had a certain positive test result or symptom or sign. Thus, the test has a TP rate of 0.65, or a sensitivity of 65%.
The lower right cell of the 2 × 2 table (TN) indicates that 900 of 1000 individuals without the disease (90%) did not have a positive test result or symptom or sign. Thus, the test has a TN rate of 0.90, or a specificity of 90%.
The FP rate is 0.10, meaning that 100 of 1000 in the normal population (10%) had the finding for some reason, without having the disease in question. This is shown in the upper right cell .
Finally, the lower left cell indicates that the test result, symptom, or sign is absent in 35 of 100 patients with the disease. Thus, the FN rate is 35%.
Note that the TP rate plus the FN rate equals 1; the FP rate plus the TN rate also equals 1. If the disease is aortic stenosis and the symptom (test condition) is syncope, then according to the preceding table, 65% of patients with aortic stenosis have syncope, and 35% do not; 90% of individuals without aortic stenosis do not have syncope, and 10% do.
Become a Clinical Tree membership for Full access and enjoy Unlimited articles
If you are a member. Log in here