Physical Address
304 North Cardinal St.
Dorchester Center, MA 02124

Most neonates requiring intensive care present with respiratory symptoms. Although standard techniques for assessing pulmonary function can be applied in a healthy infant, special limitations and problems are encountered in very small or sick neonates. Methods have been developed to evaluate pulmonary function in neonates with suspected abnormalities of the cardiopulmonary system. This section presents a practical and clinical approach to disordered cardiopulmonary function and attempts to help distinguish between heart and lung disease.
Five common physical signs relay indirect information regarding pulmonary function: respiratory rate, retractions, nasal flaring, grunting, and cyanosis.
Precise monitoring of respiratory rate is invaluable, as deviations from the normal respiratory patterns have been observed with mechanical pulmonary dysfunction, acid–base imbalances, and arterial blood gas abnormalities. During spontaneous breathing, infants can only achieve successful gas exchange within a limited range of respiratory rates. At low rates, decreased alveolar minute ventilation may occur, while at high rates and corresponding low tidal volumes (V t ), a large proportion of the minute ventilation is wasted in ventilating dead space.
Infants may also adjust the respiratory rate to minimize work of breathing. The total work of breathing consists of elastic and resistive components. The elastic component represents the work required to stretch the lungs and chest wall during a tidal inspiration, and the resistive component is the work required to overcome friction caused by lung tissue movement and gas flow through the airways. Healthy infants rely on tidal volumes of 6-7 mL/kg and approximate respiratory rates of 40-60 breaths per minute. However, during the first hour after birth respiratory rates may be higher, with approximately 50% of healthy newborns having respiratory rates greater than 60 breaths per minute. Newborns with stiff lungs, such as those with respiratory distress syndrome (RDS), attempt to compensate for the increased workload with rapid shallow breathing, whereas patients with increased resistance (e.g., subglottic stenosis) usually exhibit slower and deeper breathing ( Fig. 63.1 ).
, and increased lung resistance (R L ). RDS, Respiratory distress syndrome; RR, respiratory rate; V T , tidal volume.")
The neonatal chest wall is extremely compliant, and substernal, subcostal, and intercostal retractions are readily observable even with a relatively minor derangement in lung mechanics. Retractions are caused by negative intrapleural pressure generated by the contraction of the diaphragm and other respiratory muscles and the mechanical properties of the lungs and chest wall. In neonates with respiratory distress, retractions become more apparent as the lungs become stiffer.
Apart from their characteristic appearance in RDS and other pulmonary diseases, severe retractions can signal complications of respiratory disease such as airway obstruction, misplacement of an endotracheal tube, pneumothorax, or atelectasis (see Chapter 64 ). Decreased retractions in the presence of adequate inspiratory effort suggest that lung compliance and/or resistance is improving.
Nasal flaring is another sign of respiratory distress often observed in infants. The dilation of nostrils produced by contraction of the alae nasi muscles results in a marked reduction in nasal resistance. Because newborns are preferential nose breathers and because nasal resistance contributes substantially to total lung resistance, nasal flaring markedly decreases the work of breathing. Nasal flaring is occasionally observed in the absence of other signs of respiratory distress, particularly during feeding and active sleep.
Activation of other respiratory muscles, such as the genioglossus (tongue) and laryngeal muscles, is also important for optimal function of the upper airway. The genioglossus muscle protrudes the tongue and, in part, maintains pharyngeal patency, whereas the laryngeal muscles move the vocal cords and regulate airflow, particularly during expiration.
With normal breathing, the vocal cords abduct to enhance inspiratory flow. In some respiratory disorders and with initiation of air breathing after birth, neonates attempt to close (adduct) their vocal cords during the initial phase of expiration, holding gas in the lungs and producing an elevated transpulmonary pressure in the absence of airflow. The elevated pressure and corresponding increased lung volume result in enhancement of the ventilation–perfusion ratio (V̇/Q̇). During the last part of the expiratory phase, gas is expelled from the lungs against partially closed vocal cords, causing an audible grunt.
Grunting may be either intermittent or continuous, depending on the severity of lung disease. Grunting can maintain functional residual capacity (FRC) and partial pressure of arterial oxygen (Pa o 2 ) equivalent to the application of continuous distending pressure. Because endotracheal intubation abolishes grunting, maintenance of lung volume with positive end-expiratory pressure (PEEP) is important following intubation.
Central cyanosis, best observed by examining the tongue and oral mucosa, is an important indicator of impaired gas exchange. Clinical detection of cyanosis depends on the total amount of desaturated hemoglobin. Thus, patients with anemia may have a low Pa o 2 without clinically detectable cyanosis, and patients with polycythemia may be clinically cyanotic despite a normal Pa o 2 . Peripheral cyanosis may be normal in neonates but also occurs in situations of decreased cardiac output. The clinical features of cyanosis and their significance are discussed in detail in Part 12, The Cardiovascular System.
Maintaining optimal gas exchange is the primary function of the lung. Thus, pulmonary evaluations should include blood gas estimates in addition to measurements of pulmonary mechanics. Both invasive and noninvasive blood gas measurements are available in the neonatal population. Invasive blood gas measurements are the optimal mode for accurate measures of oxygen and carbon dioxide, whereas noninvasive measurements are ideal for continuous documentation of the rapid changes that occur in this population. These rapid changes in blood gas values begin with the initiation of the first breath after normal delivery, resulting in a rapid fall in Pa co 2 within minutes of birth. During this time, Pa o 2 rises quickly to levels of 60-90 mm Hg, although some degree of mismatching of V̇/Q̇ is evident during the first day after birth. This is believed to be the result of intracardiac and pulmonary right-to-left shunting. Data in larger groups of infants have characterized the increase in oxygenation following birth by way of pulse oximetry, allowing for further differentiation between preductal and postductal levels ( Fig. 63.2 ). (See also Chapter 33 .) The speed with which pulmonary ventilation and perfusion are uniformly distributed is an indication of the neonate's remarkable capacity for maintaining homeostasis.
")
During the early weeks of postnatal life, preterm infants are exceptionally unstable, requiring close monitoring of blood gas status. Pulse oximetry and blood gas measurements are the most widely used clinical methods for assessing pulmonary function in neonates and form the basis for diagnosis and management of cardiorespiratory disease.
Changes in partial pressure of alveolar oxygen (P ao 2 ) and P aco 2 can identify disordered pulmonary function in various clinical situations. P ao 2 and P aco 2 values depend on the composition and volume of alveolar gas, the composition and volume of the mixed venous blood, and the mechanisms of pulmonary gas exchange impairment. Alveolar gas composition can be obtained from the equation
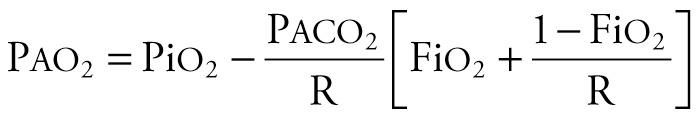
where PiO 2 is partial pressure of inspired oxygen (PiO 2 = Fi o 2 × [barometric pressure − water vapor pressure]). At sea level, barometric pressure is 760 mm Hg; at 100% humidity, water vapor pressure is 47 mm Hg. P aco 2 is the partial pressure of alveolar carbon dioxide, and R is the respiratory quotient (usually 0.8). The mechanisms of pulmonary gas exchange impairment include V̇/Q̇ mismatch, shunt, hypoventilation, and diffusion limitation. Appropriate matching of the alveolar gas with the mixed venous blood yields optimal gas exchange. Mixed venous blood composition and volumes are determined by the arterial blood gas content, cardiac output, oxygen consumption, and carbon dioxide production.
Techniques of blood gas determination in infants with RDS are discussed in Chapter 64 . Gas exchange during assisted ventilation is discussed in Chapter 65 . Acid–base physiology is discussed in Chapter 92 .
Depending on the efficacy of gas exchange, the alveolar oxygen partial pressure (tension) tends to equilibrate with the mixed venous blood, resulting in the Pa o 2 , which determines the degree of oxygen saturation of hemoglobin. In addition to its chemical combination with hemoglobin, oxygen is also dissolved in plasma and red blood cells (RBCs). Most of the oxygen in whole blood is bound to hemoglobin (measured clinically as oxygen saturation), whereas the amount of dissolved oxygen is only a small fraction of the total quantity carried in whole blood.
The quantity of oxygen bound to hemoglobin depends on the Pa o 2 and the oxygen dissociation curve ( Fig. 63.3 ). The blood is almost completely saturated at a Pa o 2 of 90-100 mm Hg. The flattening of the upper portion of the S-shaped dissociation curve makes it virtually impossible to estimate oxygen tension greater than 60-80 mm Hg by using arterial oxygen saturation alone. The dissociation curve of fetal hemoglobin (compared with adult hemoglobin) is shifted to the left, and at any Pa o 2 less than 100 mm Hg, fetal blood binds more oxygen. The shift appears to be the result of the lower affinity of fetal hemoglobin for 2,3-diphosphoglycerate. Note that pH, Pa co 2 , temperature, and diphosphoglycerate (DPG) content influence the position of the dissociation curve.
 DPG, Diphosphoglycerate.")
Arterial oxygen content (Ca o 2 ) is the sum of hemoglobin-bound and dissolved oxygen, as described by the following equation:

where the arterial oxygen content is in mL/100 mL of blood, 1.37 is the approximate amount of oxygen (in milliliters) bound to 1 g of hemoglobin at 100% saturation, Hb is hemoglobin concentration (g/100 mL), Sa o 2 is the percentage of hemoglobin bound to oxygen, and 0.003 is the solubility factor of oxygen in plasma (mL/mm Hg). In this equation, the first term (1.37 × Hb × Sa o 2 ) is the amount of oxygen bound to hemoglobin. The second term (0.003 × Pa o 2 ) is the amount of oxygen dissolved in plasma and red blood cells.
Most of the oxygen in the blood is carried by hemoglobin. For example, if an infant has a Pa o 2 of 80 mm Hg, an Sa o 2 of 99%, and a hemoglobin concentration of 15 g/100 mL, Ca o 2 is the sum of oxygen bound to hemoglobin ([1.37 × 15 × 99]/100 = 20.3 mL) plus the oxygen dissolved in plasma (0.003 × 80 = 0.24 mL). In this example, just over 1% of oxygen in blood is dissolved in plasma and almost 99% is carried by hemoglobin.
The partial pressure of oxygen in arterial blood not only depends on the ability of the lungs to transfer oxygen as determined by alveolar ventilation but also is largely influenced by the V̇/Q̇. For normal gas exchange, the ventilation and perfusion should be proportional. The ratio should be very close to 1 : 1; that is, for every milliliter of gas that passes the alveoli, there should be a proportional volume of blood in the pulmonary capillary bed. If the V̇/Q̇ is decreased (as in RDS), only partial oxygenation and CO 2 removal from the mixed venous blood will occur. Oxygen supplementation can largely overcome the hypoxemia when the V̇/Q̇ is decreased. If the V̇/Q̇ is high, as in overventilation, partial pressure of oxygen is increased slightly.
The mechanism of shunting becomes evident when blood bypasses the alveoli, as occurs in congenital cyanotic heart disease, persistent pulmonary hypertension, or atelectasis. Oxygen supplementation does not prevent the hypoxemia produced by such a shunt. Hypoventilation (e.g., caused by apnea) is a common cause of hypoxemia. Diffusion limitation can affect oxygenation slightly, but this mechanism is not a common cause of severe hypoxemia in neonates. Hypoxemia caused by either hypoventilation or diffusion limitation usually can be treated easily with oxygen supplementation.
Three indexes can be used to estimate the degree of oxygenation derangement (see Chapter 70 ). The arterial–alveolar oxygen tension ratio (Pa o 2 /P a o 2 or a/ a o 2 ratio) has no units, decreases with worsening oxygenation, and can be obtained from the equation
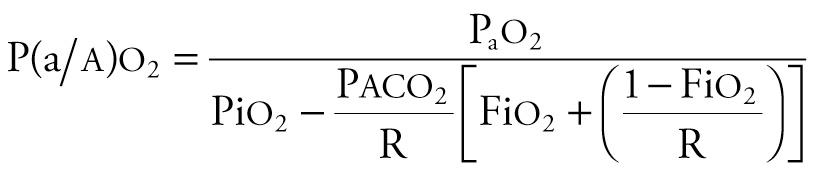
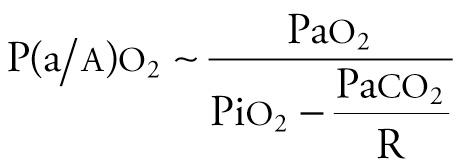
where R is the respiratory quotient. Because [Fi o 2 + (1 − Fi o 2 )/R] approximates 1.0, and P aco 2 approximates Pa co 2 , the equation can be simplified as follows:
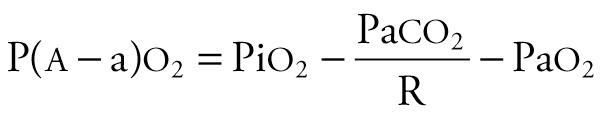
The alveolar–arterial oxygen tension gradient (P ao 2 − Pa o 2 or AaDO 2 ) is expressed in mm Hg, increases with worsening oxygenation and can be obtained from the equation

The oxygenation ratio is expressed in mm Hg, decreases with worsening oxygenation, and can be obtained from the equation
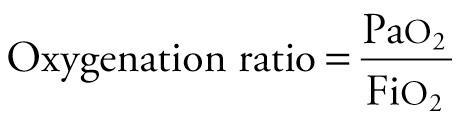
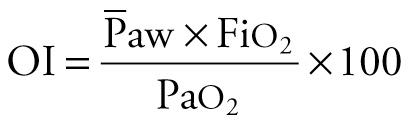
The oxygenation ratio is less often used because it is subject to inaccurate assessment of the oxygenation derangement when Pa co 2 varies markedly. Often, it is necessary to correct the degree of oxygenation for the ventilatory support, because oxygenation is strongly influenced by mean airway pressure (  ) during assisted ventilation. The oxygenation index (OI) is useful under these circumstances. The OI, which increases with worsening oxygenation or increasing
  , has units of centimeters of water per mm Hg and can be obtained by the equation
Become a Clinical Tree membership for Full access and enjoy Unlimited articles
If you are a member. Log in here