Physical Address
304 North Cardinal St.
Dorchester Center, MA 02124

THE PHARMACOKINETICS AND PHARMACODYNAMICS of most medications in children, especially neonates, differ from those in adults. Children exhibit different pharmacokinetics (PK) and pharmacodynamics (PD) from adults because of their immature renal and hepatic function, different body composition, altered protein binding, distinct disease spectrum, diverse behavior, and dissimilar receptor patterns. PK differences necessitate modification of the dose and the interval between doses to achieve the desired concentration associated with a clinical response and to avoid toxicity. In addition, some medications may displace bilirubin from its protein binding sites and possibly predispose to kernicterus in premature neonates. Drug effect (PD) may be influenced by altered capacity of the end organ, such as the heart or bronchial smooth muscle, to respond to medications in children compared with adults. In this chapter we discuss basic pharmacologic principles as they relate to drugs commonly used by anesthesiologists.
Changes in drug concentrations within the body over time are referred to as pharmacokinetics . The principles and equations that describe these changes can be used to adjust drug doses rationally to achieve more effective drug concentrations at the site of action. The equations in this section are intended for general and practical use, whereas the more rigorous mathematical intricacies of PK are covered elsewhere.
Within the body, a drug may diffuse between several body fluids and tissues at different rates, yet the consistent change in its circulating concentration may be used to characterize its kinetics and to guide dosages. The rate of removal of drug from the circulation is usually described using either first-order or zero-order exponential equations. The difference between these two types of rates has important implications for drug treatment.
Most drugs are cleared from the body with first-order exponential rates in which a constant fraction or constant proportion of drug is removed per unit of time. Because the proportion of drug cleared remains constant, the greater the concentration, the greater the amount of drug removed from the body. Such rates can be described by exponential equations that fit the following form:
where C is the concentration at time t, C 0 is the starting concentration (a constant determined by the dose and distribution volume), e is the base of the natural logarithm (~2.71828), and k is the elimination rate constant with units of time −1 . First-order indicates that the exponent is raised to the first power (− k t in Eq. 7.1 ). Second-order equations are those that are raised to the second power, such as e (z)2 . First-order exponential equations, such as Eq. 7.1 , may be converted to the form of the equation of a straight line (y = mx + b, where x and y are variables [e.g., time and concentration], m is the slope parameter, and b is a constant) by taking the natural logarithm of both sides, after which they may be solved by linear regression.
If ln C (i.e., natural logarithm of C) is graphed versus time, the slope is −k, and the intercept is ln C 0 . If log C (i.e., common logarithm of C) is graphed versus time, the slope is −k /2.303, because ln x equals 2.303 log x . When graphed on linear-linear axes, exponential rates are curvilinear and on semilogarithmic axes, they produce a straight line.
Half-life, the time for a drug concentration to decrease by one-half, is a familiar exponential term used to describe the kinetics of many drugs. Half-life is a first-order kinetic process because the same proportion or fraction of the drug is removed during equal periods of time. As described earlier, the greater the starting concentration, the greater the amount of drug removed during each half-life.
Half-life can be determined by several methods. If concentration is converted to the natural logarithm of concentration and graphed versus time, as described in Eq. 7.2 , the slope of this graph is the elimination rate constant, k. For both accuracy and precision, at least three concentration-time points should be used to determine the slope, and they should be obtained over an interval during which the concentration decreases at least by half. In clinical practice, for infants and small children, however, k is often estimated from just two concentrations obtained during the terminal elimination phase. With multiple data points, the slope of ln C versus time may be calculated easily by least squares linear regression analysis. Half-life ( T 1/2 ) may be calculated from the elimination rate constant, k (time −1 ), as follows:
Graphic techniques may be used to determine half-life from a series of timed measurements of drug concentration. The concentration-time points should be graphed on semilogarithmic axes and used to determine the best-fitting line either visually or by linear regression analysis. This approach is illustrated in Fig. 7.1 , in which the least squares regression line has been fitted to the concentration-time points and crosses a concentration of 20 µg/mL at 100 minutes and a concentration of 10 µg/mL at 200 minutes. The concentration decreased by one-half in 100 minutes, so the half-life is 100 minutes. The elimination rate constant is 0.693/100 per minute or 0.00693 per minute.

Elimination half-life is of no value for characterizing the disposition of many intravenous (IV) anesthetic drugs during dosing periods relevant to anesthesia. A more useful concept is that of the context-sensitive half-time (CSHT) where “context” refers to the duration of the infusion. This is the time required for the plasma drug concentration to decrease by 50% after terminating the infusion. The CSHT is the same as the elimination half-life for a one-compartment model and does not change with the duration of the infusion. However, most drugs in anesthesia conform to multiple compartment models and the CSHTs are markedly different from their respective elimination half-lives.
CSHT may be independent of the duration of the infusion (e.g., remifentanil, 2.5 minutes); be moderately affected (propofol, 12 minutes at 1 hour, 38 minutes at 8 hours); or display marked prolongation (e.g., fentanyl, 1 hour at 24 minutes, 8 hours at 280 minutes). This is a result of the return of drug from peripheral compartments to plasma after stopping the infusion. Peripheral compartment sizes and clearances in children differ from adults and at termination of the infusion, more or less drug remains in the body in children for any given plasma concentration compared with adults. The CSHT for propofol in children, for example, is greater than that in adults. The CSHT gives insight into the PK of a drug, but the parameter may not be clinically relevant; the percentage decrease in concentration required for recovery from the drug effect is not necessarily 50%.
The number of exponential equations required to describe the change in concentration determines the number of compartments. Although a drug may diffuse among several tissues and body fluids, its clearance often fits first-order, single-compartment kinetics if it quickly distributes homogeneously within the circulation and is removed rapidly from the circulation through metabolism or excretion. This may be judged visually if a semilogarithmic graph of the change in drug concentration fits a single straight line. Kinetics may appear to be single-compartment, when they are really multiple compartments, if drug concentrations are not measured soon enough after IV administration to detect the initial distribution phase (α phase).
If drug concentrations are measured several times within the first 15 to 30 minutes after IV administration as well as during a more prolonged period, more than one elimination phase is often present. This can be observed as a marked change in slope of a semilogarithmic graph of concentration versus time ( Fig. 7.2 ). The number and nature of the compartments required to describe the clearance of a drug do not necessarily represent specific body fluids or tissues. When two first-order exponential equations are required to describe the clearance of drug from the circulation, the kinetics are described as first-order, two-compartment (e.g., central and peripheral compartments) that fit the following equation (see Fig. 7.2 ):
where concentration is C, t is time after the dose, A is the concentration at time 0 for the distribution rate represented by the purple line graph with the steepest slope, α is the rate constant for distribution, e is base of natural logarithm, B is the concentration at time 0 for the terminal elimination rate, and β is the rate constant for terminal elimination. Rate constants indicate the rates of change in concentration and each corresponds to the slope of the respective line divided by 2.303 for logarithm concentration versus time.
/2.303. The terminal elimination phase has a slope = β(elimination rate constant)/2.303.")
Such two-compartment or biphasic kinetics are frequently observed after IV administration of drugs that rapidly distribute out of the central compartment of the circulation to a peripheral compartment. In such situations, the initial rapid decrease in concentration is referred to as the α or distribution phase and represents distribution to the peripheral (tissue) compartments in addition to drug elimination. The terminal (β) phase begins after the inflection point in the line when elimination starts to account for most of the change in drug concentration. To determine the initial change in concentration as a result of distribution (see Fig. 7.2 ), the change in concentration that results from elimination must be subtracted from the total change in concentration. The slope of the line representing the difference between these two rates is the rate constant for distribution.
These parameters (A, B, α, β) have little connection with underlying physiology, and an alternative parameterization is to use a central volume and three rate constants ( k 10 , k 12 , k 21 ) that describe drug distribution between compartments. Another common method is to use two volumes (central, V1; peripheral, V2) and two clearances (CL, Q). Q is the intercompartment clearance, and the volume of distribution at steady state (Vdss) is the sum of V1 and V2. A more detailed mathematical discussion may be found elsewhere.
Although many drugs demonstrate multiple-compartment kinetics, traditional studies of kinetics in neonates did not include enough samples immediately after dosing to identify more than one compartment. For clinical estimates of dose and dosing intervals, it is often not necessary to use multiple-compartment kinetics. To minimize cost, limit blood loss, and simplify PK calculations, dose adjustments are often based on only two plasma concentrations (peak and trough), and linear, single-compartment kinetics (such as that of gentamicin and vancomycin) is assumed. Because the elimination rate constant should be determined from the terminal elimination phase, it is important that peak concentrations of multiple-compartment drugs not be drawn prematurely—that is, during the initial distribution phase. If drawn too early, the concentrations will be greater than those during the terminal elimination phase (see Fig. 7.2 ), which will overestimate the slope and the terminal elimination rate constant. Population modeling has improved analysis and interpretation of such data.
The elimination of some drugs occurs with loss of a constant amount per time, rather than a constant fraction per time. Such rates are termed zero-order, and because e 0 = 1, the change in the amount of drug in the body fits the following equation :
where dA is the change in the amount of drug in the body (in milligrams), dt is the change in time, and k 0 is the elimination rate constant with units of amount per unit time. After solving this equation, it has the following form:
where A 0 is the initial amount of drug in the body and A is the amount of drug in the body (in milligrams) at time t.
Zero-order (also known as Michaelis-Menten) kinetics may be designated saturation kinetics, because such processes occur when excess amounts of drug saturate the capacity of metabolic enzymes or transport systems. In this situation, only a constant amount of drug is metabolized or transported per unit of time. If kinetics are zero order, a graph of serum concentration versus time is linear on linear-linear axes and is curved when graphed on linear-logarithmic (i.e., semilogarithmic) axes. Clinically, first-order elimination may become zero order after administration of excessive doses or prolonged infusions or during dysfunction of the organ of elimination. Certain drugs administered to neonates exhibit zero-order kinetics at therapeutic doses and may accumulate to excessive concentrations, including thiopental, theophylline, caffeine, diazepam, furosemide, and phenytoin. Some drugs (e.g., phenytoin, ethyl alcohol) may exhibit mixed-order kinetics (i.e., first order at low concentrations and zero order after enzymes are saturated at greater concentrations). For these drugs, a small increment in dose may cause disproportionately large increments in serum concentrations ( Fig. 7.3 ).
 followed by a change to saturation kinetics at 24 hours with elimination of 1 mg/hour, leading to drug accumulation to toxic concentrations.")
The apparent volume of distribution (Vd) is a mathematical term that relates the dose to the circulating concentration observed immediately after administration. It might be viewed as the volume of dilution that can be used to predict the change in concentration after a dose is diluted within the body (i.e., a scaling factor). Vd does not necessarily correspond to a physiologic body fluid or tissue volume, hence the designation “apparent.” For drugs that distribute out of the circulation or bind to tissues, such as digoxin, Vd may reach 10 L/kg, a physical impossibility for a fluid compartment in the body. This illustrates the mathematical nature of Vd. The units used to express concentration are amount per unit volume, and dose is expressed as the amount per kilogram and the Vd as volume per kilogram that dilutes the dose to produce the concentration as the ratio:
If concentration is expressed with the unconventional units of milligrams per liter rather than micrograms per milliliter (which are equivalent), it is easier to balance the equation. This equation serves as the basis for most of the PK calculations because it is easily rearranged to solve for Vd and dose. It is also important to note that this equation represents the change in concentration after a rapidly administered IV dose of a drug. After a mini-infusion (e.g., of vancomycin or gentamicin), a more complex exponential equation may be required to account for drug elimination during the time of infusion. For neonates in whom drug elimination is relatively slow, only a small fraction of drug is eliminated during the time of infusion, and such adjustments can be omitted, whereas more complex equations may be needed in older children.
Knowledge of the apparent Vd is essential for dose adjustments. Vd may be calculated by rearranging Eq. 7.7 :
The concentration after a drug infusion, C (postdose), must be measured after the distribution phase to avoid overestimating the peak concentration that would, in turn, lead to an erroneously low Vd. For the first dose, the predose concentration is 0.
The following example illustrates the application of these PK principles using a four-step approach: (1) calculate Vd; (2) calculate half-life; (3) calculate a new dose and dosing interval based on a desired peak and trough; and (4) check the peak and trough of the new dosage regimen.
For example, vancomycin was administered in a dose of 15 mg/kg IV over 60 minutes every 12 hours. The plasma concentrations were measured on the third day of treatment (presumed steady state). The predose or trough concentration was 12 mg/L; the peak concentration, measured 60 minutes after the end of the infusion, was 32 mg/L:
Step 1: Substituting the data into Eq. 7.8 , we calculate Vd.
Step 2: At steady state, peak and trough concentrations reach the same levels after each dose. The time between the peak and trough concentrations is 10 hours—that is, 12 hours minus 1 hour infusion minus 1 hour to peak concentration. Half-life may be solved by rearranging Eq. 7.2 to solve for k (elimination rate constant) and substituting the calculated k into Eq. 7.3 . In this case, the calculated elimination rate constant is 0.098/hour and the corresponding half-life is 7.1 hours. However, a practical and clinically applicable “bedside” approach may be used without need for logarithmic calculations. For example, the plasma concentration decreased from 32 to 16 mg/L in one half-life and then from 16 to 12 mg/L in a fraction of the second half-life. At the end of the second half-life, the concentration would have decreased to 8 mg/L. Because 12 mg/L is the midpoint between the first and second half-lives, 1.5 half-lives have elapsed during the 10 hours between the peak and trough. Thus if one assumes a linear decline, the half-life may be estimated as 6.67 hours (10 hours ÷ 1.5 half-lives). Note that the error between the actual half-life of 7.1 hours and the estimated half-life (6.67 hours) is a result of the linear assumptions of this calculation between half-lives. In fact, first-order elimination is a nonlinear process and concentration will actually decline from 32 mg/L to 22.6 mg/L during the first 50% of the first half-life rather than from 32 mg/L to 24 mg/L using this linear approach. The same occurs during subsequent half-lives. However, the small error associated with this method is often acceptable for rapid bedside estimates of PK parameters.
Step 3: A new dosage regimen must be calculated if the concentrations are unsatisfactory. Accordingly, one must decide on a desired peak and trough concentration. If, for example, the desired vancomycin peak and trough concentrations were 32 mg/L (20–40 mg/L) and 8 mg/L (5–10 mg/L), respectively, then Eq. 7.8 may be rearranged to solve for the new dose:
The current dose produces a peak of 32 mg/L that is in the recommended therapeutic range, and extending the dosing interval to 2 half-lives (hours) after the peak is reached (2 hours after beginning the dose infusion) will produce a trough concentration of 8 mg/L. The dose interval should be increased to 16 hours and the dose increased to 18 mg/kg.
Step 4: Estimating peak and trough concentrations with the new regimen provides a good double-check against a mathematical error. Sixteen hours after the 15 mg/kg dose is administered (or approximately 2 half-lives after the measured peak), the trough should be approximately 8 mg/L. At this time, administration of 18 mg/kg will increase the concentration by 24 mg/L (assuming a Vd of 0.75 L/kg) to a peak concentration of 32 mg/L.
When multiple doses are administered, the dose is usually repeated before complete elimination of the previous one. In this situation, peak and trough concentrations increase until a steady-state concentration (C ss ) is reached (see Fig. 7.3 ). The average C ss (AvgC ss ) can be calculated as follows :
In Eqs. 7.10 and 7.11 , f is the fraction of the dose that is absorbed, D is the dose, τ is the dosing interval in the same units of time as the elimination half-life, k is the elimination rate constant, and 1.44 equals the reciprocal of 0.693 (see Eq. 7.3 ). The magnitude of the average C ss is directly proportional to the ratio of T 1/2 /τ and D.
Steady state occurs when the amount of drug removed from the body between doses equals the amount of the dose. Five half-lives are usually required for drug elimination and distribution among tissue and fluid compartments to reach equilibrium. When all tissues are at equilibrium (i.e., steady state), the peak and trough concentrations are identical after each dose. However, before this time, constant peak and trough concentrations after intermittent doses, or constant concentrations during drug infusions, do not prove that a steady state has been achieved because the drug may still be entering and leaving deep tissue compartments. During continuous infusion, the fraction of steady-state concentration that has been reached can be calculated in terms of multiples of the drug's half-life. After 3 half-lives, the concentration is 88% of that at steady state. When changing doses during chronic drug therapy, the concentration should usually not be rechecked until several half-lives have elapsed, unless elimination is impaired or signs of toxicity occur. Drug concentrations may not need to be checked if symptoms improve.
If the time to reach a constant concentration by continuous or intermittent dosing is excessive (e.g., 3–5 half-lives), a loading dose may be used to reach the target concentration or plateau in the concentration more rapidly. Propofol is usually given as a loading dose before establishing an infusion for anesthesia. The same principle is applied to the initial treatment with digoxin, which has a 35- to 69-hour half-life in term neonates and an even greater half-life in preterm infants. Use of a loading dose increases the circulating concentration of drug earlier in the therapeutic course. Loading doses must be used cautiously, because they increase the likelihood of drug toxicity, as has been observed with loading doses of digoxin.
Dose calculations using a one-compartment model (see Eq. 7.9 ) may not be applicable to many anesthetic drugs that are characterized using multi-compartment models. The use of V1 (central Vd) results in a loading dose that is too large, whereas the use of Vdss (Vd at steady-state) results in a loading dose that is too small. Too large a dose may cause transient toxicity, although slowing the rate of administration may prevent excessive concentrations during the distributive phase.
The time to peak effect (Tpeak) depends on the clearance and effect-site equilibration half-time (T 1/2 keo). At a submaximal dose, Tpeak is independent of dose. At supramaximal doses, maximal effect will occur earlier than Tpeak and persist for a greater duration because of the shape of the response curve (see later discussion). The Tpeak concept has been used to calculate optimal dose for initial boluses, because V1 and Vdss poorly reflect the required scaling factor. A new parameter, the Vd at the time of peak effect-site concentration ( Vpe ) is used and calculated as follows:
where C 0 is the theoretical plasma concentration at t = 0 after the bolus dose, and Cpeak is the predicted effect-site concentration at the time of peak effect-site concentration. Loading dose ( LD ) can then be calculated as
Pediatric anesthesiologists have embraced the population approach for investigating PK and PD. This approach, achieved through nonlinear mixed-effects models, provides a means to study variability in drug responses among individuals representative of those in whom the drug will be used clinically. Traditional approaches to interpretation of time-concentration profiles relied on “rich” data from a small group of subjects. In contrast, mixed effects models can be used to analyze “sparse” data (two to three samples) from each one of a large number of subjects. Sampling times are not crucial for population methods and can be fit around clinical procedures or outpatient appointments. Sampling time bands rather than exact times is equally effective and allows flexibility in children. Interpretation of truncated individual sets of data or missing data is also possible with this type of analysis, rendering it particularly useful for pediatric studies. Population modeling also allows pooling of data across studies to provide a single robust PK analysis rather than comparing separate smaller studies that are complicated by different methods and analyses.
Mixed-effects models are “mixed” because they describe the data using a mixture of fixed and random effects. Fixed effects predict the average influence of a covariate, such as weight, as an explanation of some of the variability between subjects in a parameter like clearance. Random effects describe the remaining variability among subjects that are not predictable from the fixed effect average. Explanatory covariates (e.g., age, size, renal function, sex, temperature) can be introduced that explain the predictable part of the between-individual variability. Nonlinear regression is performed by an iterative process to find the curve of best fit.
Growth and development are two major aspects of children not readily apparent in adults. How these factors interact is not necessarily easy to determine from observations because they are quite highly correlated. Drug clearance, for example, may increase with weight, height, age, body surface area (BSA), and creatinine clearance. One approach is to standardize for size before incorporating a factor for maturation.
Clearance in children 1 to 2 years of age, expressed as liters per hour per kilogram, is commonly greater than that observed in older children and adolescents. This is a size effect and is not because of bigger livers or increased hepatic blood flow in that subpopulation. This “artifact of size” disappears when allometric scaling is used. Allometry is a term used to describe the nonlinear relationship between size and function. This nonlinear relationship is expressed as
where y is the variable of interest (e.g., basal metabolic rate [BMR]), a is a scaling parameter, and PWR is the allometric exponent. The value of PWR has been the subject of much debate. BMR is the most common variable investigated, and camps advocating for a PWR value of
![]() (i.e., BSA) are at odds with those advocating a value of
(i.e., BSA) are at odds with those advocating a value of
![]() . Support for a value of
. Support for a value of
![]() comes from investigations that show the log of BMR plotted against the log of body weight produces a straight line with a slope of
comes from investigations that show the log of BMR plotted against the log of body weight produces a straight line with a slope of
![]() across all species studied, including humans. Clearance is a metabolic process and the log of clearance plotted against the log of body weight also produces a straight line with a slope of
across all species studied, including humans. Clearance is a metabolic process and the log of clearance plotted against the log of body weight also produces a straight line with a slope of
![]() when different species are studied. Fig. 7.4 exemplifies this for tramadol. Fractal geometry mathematically explains this phenomenon. The
when different species are studied. Fig. 7.4 exemplifies this for tramadol. Fractal geometry mathematically explains this phenomenon. The
![]() -power law for metabolic rates was derived from a general model that describes how essential materials are transported through space-filled fractal networks of branching tubes. A great many physiologic, structural, and time-related variables scale predictably within and between species with weight ( W ) exponents ( PWR ) of
-power law for metabolic rates was derived from a general model that describes how essential materials are transported through space-filled fractal networks of branching tubes. A great many physiologic, structural, and time-related variables scale predictably within and between species with weight ( W ) exponents ( PWR ) of
![]() , 1, and
, 1, and
![]() , respectively.
, respectively.
 compared with human allometric prediction (solid line) using a -power exponent (solid line).")
These exponents have applicability to PK parameters; for example, the exponent for clearance (CL) is ![]() , volume (V) is 1, and half-time ( T 1/2 ) is
, volume (V) is 1, and half-time ( T 1/2 ) is ![]() . The factor for size ( Fsize ) for total drug clearance may be expressed as
. The factor for size ( Fsize ) for total drug clearance may be expressed as
Remifentanil clearance in children aged 1 month to 9 years is similar to adult rates when scaled using an allometric exponent of ![]() . Nonspecific blood esterases that metabolize remifentanil are mature at birth.
. Nonspecific blood esterases that metabolize remifentanil are mature at birth.
Allometry alone is insufficient to predict clearance in neonates and infants from adult estimates for most drugs. The addition of a model describing maturation is required. The sigmoid hyperbolic or Hill model has been found useful for describing this maturation process ( MF ):
The TM 50 describes the maturation half-time, while the Hill coefficient relates to the slope of this maturation profile. Maturation of clearance begins before birth, suggesting that postmenstrual age ( PMA ) would be a better predictor of drug elimination than postnatal age (PNA). Fig. 7.5 shows the maturation profile for dexmedetomidine, expressed as both the standard per-kilogram model and by using allometry. Clearance is immature in infancy. Clearance, expressed as per kilogram, is greatest at 2 years of age, decreasing subsequently with age. This “artifact of size” disappears with use of the allometric model. Appropriate size scaling shows that the PK in children (>2 years old) is similar to adults. Maturation changes are generally completed within the first 2 years of postnatal life; consequently, infants may be considered as immature children, whereas children are just small adults.
 maturation profile of dexmedetomidine, expressed using the per-kilogram model and the allometric -power model. This maturation pattern is typical of many drugs cleared by the liver or kidneys.")
Changes associated with normal growth and development can be distinguished from pathologic changes describing organ function. Morphine clearance is reduced in neonates because of immature glucuronide conjugation, but clearance was lower in critically ill neonates than healthier cohorts, possibly attributable to reduced hepatic function. The impact of organ function alteration may be concealed by another covariate. For example, positive-pressure ventilation may be associated with reduced morphine clearance. This effect may be attributable to a consequent reduced hepatic blood flow with a drug that has perfusion limited clearance (e.g., propofol, morphine).
Creatinine clearance is commonly used as a measure of renal function and dictates dose of those drugs cleared by that organ. Renal function in children can be estimated using formulae that allow estimation of glomerular filtration rate (GFR) from clinical characteristics. These formulae use simple markers such as height, plasma creatinine concentration and BSA. Estimation of GFR is acceptable in adults, but prediction is poor in children with a GFR value less than 40 mL/minute. We might expect the maturation of creatinine clearance, a marker for GFR, to reflect the influences of size, maturation, and organ function. Estimation methods such as those of Schwartz incorporate a size factor (body length or height) and a scaling factor (k) that is age dependent (e.g., k = 0.33 for premature neonates; k = 0.45 for term infants 0–1 year; k = 0.55 for 1–12 years; k = 0.7 for 13- to 21-year old adolescent males :
Creatinine clearance estimation overpredicts GFR in children, possibly because of tubular secretion. Tubular reabsorption may also create inaccuracies in premature neonates. Dosing of renally cleared drugs in premature neonates should be based on size- and maturation-based predictions of GFR alone, and serum creatinine should not be used as a base until creatinine production rate predictions in this age group are better established. Pharmacokinetic parameters ( P ) can be described in an individual as the product of size ( Fsize ), maturation ( MF ), and organ function ( OF ) influences, where Pstd is the parameter value in a standard size adult without pathologic changes in organ function :
Pharmacokinetics is what the body does to the drug, while pharmacodynamics is what the drug does to the body. The precise boundary between these two processes is ill defined and often requires a link describing movement of drug from the plasma to the effect site and its target. Drugs may exert effects at nonspecific membrane sites, by interference with transport mechanisms, by enzyme inhibition or induction, or by activation or inhibition of receptors.
The minimal effective analgesic concentration can be established by titration of an analgesic to achieve satisfactory pain at rest or with a painful stimulus. Blood assay for analgesic drug concentration at these times can be used to determine the effective concentration. Further blood assays when pain recurs or when further analgesics are required improve the accuracy of assessment. This technique has been used to determine the minimal effective analgesic concentration of oxycodone.
The relation between drug concentration and effect may be described by the Hill equation or Emax model (see maturation model above) :
where E 0 is the baseline response, Emax is the maximum effect change, Ce is the concentration in the effect compartment, EC 50 is the concentration producing 50% Emax, and N is the Hill coefficient defining the steepness of the concentration-response curve ( Fig. 7.6 ). Efficacy is the maximum response on a dose or concentration-response curve. EC 50 can be considered a measure of potency relative to another drug, provided N and Emax for the two drugs are the same.
 dramatically alters the shape of the curve.")
This model has been used to describe propofol PD in children 1 to 16 years of age using bispectral index as an effect measure. The E 0 was estimated as 93.2, Emax –83.4, EC 50 5.2 mg/L, and N 1.4. Similar relationships have been described in other groups of children. Remifentanil hypotensive effects and acetaminophen analgesic effects in children have also been described using this model.
The potency of anesthetic vapors may be expressed by minimum alveolar concentration (MAC), and this is the concentration at which 50% of subjects move in response to a standard surgical stimulus. MAC appears, at first sight, to be similar to EC 50 , but is an expression of quantal response rather than magnitude of effect. There are two methods of estimating MAC. Responses can be recorded over the clinical dose range in a large number of subjects and logistic regression applied to estimate the relationship between dose and quantal effect; the MAC can then be interpolated. Large numbers of subjects may not be available, so an alternative method is often used. The “up-and-down” method described by Dixon estimates only the MAC rather than the entire sigmoid curve. It usually involves a study of only one concentration in each subject and, in a sequence of subjects, each receives a concentration depending on the response of the previous subject; the concentration is either decreased if the previous subject did not respond or increased if they did. The MAC is calculated either as the mean concentration of equal numbers of responses and no responses or is the mean concentration of pairs of “response–no response.” This technique has also been used to determine the EC 50 of local anesthetic dugs used in central blockade.
When the pharmacologic effect is difficult to grade, then it may be useful to estimate the probability of achieving the effect as a function of plasma concentration. Effect measures, such as movement/no movement or rousable/nonrousable, are dichotomous. Logistic regression is commonly used to analyze such data and the interpolated EC 50 value refers to the probability of response. For example, an EC 50 of 0.52 mg/L for arousal after ketamine sedation in children has been estimated using this technique.
A simple situation in which drug effect is directly related to concentration does not mean that drug effects parallel the time course of concentration. This occurs only when the concentration is low in relation to EC 50 . In this situation the half-life of the drug may correlate closely with the half-life of drug effect. Observed effects may not be directly related to serum concentration. Many drugs have a short half-life but a long duration of effect. This may be attributable to induced physiologic changes (e.g., aspirin and platelet function) or may be a result of the shape of the Emax model. If the initial concentration is very high in relation to the EC 50 , then drug concentrations 5 half-lives later, when we might expect a minimal concentration, may still exert considerable effect.
There may also be a delay as a result of transfer of the drug to the effect site (e.g., neuromuscular blockers [NMBDs]), a lag time (e.g., diuretics), physiologic response (e.g., antipyresis), active metabolite (e.g., valdecoxib), or synthesis of physiologic substances (e.g., warfarin). A plasma concentration-effect plot can form a hysteresis loop because of this delay in effect. Hull and Sheiner introduced the effect compartment concept for NMBDs. A single first-order parameter (T 1/2 keo) describes the equilibration half-time. This mathematical trick assumes that the concentration in the central compartment is the same as that in the effect compartment at equilibration, but that a time delay exists before drug reaches the effect compartment. The concentration in the effect compartment is used to describe the concentration-effect relationship.
Adult T 1/2 keo values are well described (e.g., morphine, 16 minutes; fentanyl, 5 minutes; alfentanil, 1 minute; propofol, 3 minutes). This T 1/2 keo parameter is commonly incorporated into target-controlled infusion pumps to achieve a rapid effect-site concentration. The adult midazolam T 1/2 keo of 5 minutes may be prolonged in the elderly, resulting in overdose if this is not recognized during dose titration.
The T 1/2 keo for propofol in children has been described. As expected, a shorter T 1/2 keo with decreasing age based on size models has been observed. Similar results have been demonstrated for sevoflurane and changes in the electroencephalogram (EEG). If the effect site is targeted and Tpeak is anticipated to be later than it actually is because it was determined in a teenager or adult, this will result in excessive dose in a young child.
Acidic drugs (e.g., diazepam, barbiturates) tend to bind mainly to albumin, whereas basic drugs (e.g., amide local anesthetic agents) bind to globulins, lipoproteins, and glycoproteins. In general, plasma protein binding of many drugs is decreased in the neonate relative to the adult in part because of reduced total protein and albumin concentrations ( Fig. 7.7 ). Many drugs that are highly protein bound in adults have less of an affinity for protein in neonates ( E-Fig. 7.1 ). Reduced protein binding increases the free fraction of medications, thus providing more free medication and greater pharmacologic effect. This effect is particularly important for medications that are highly protein bound, because the reduced protein binding increases the free fraction of the medication to a greater extent than for low protein-bound drugs. For example, phenytoin is 85% protein bound in healthy infants but only 80% in those who are jaundiced. This equates to a 33% increase in the free fraction of phenytoin when jaundice occurs ( E-Fig. 7.2 ). Differences in protein binding may have considerable influence on the response to medications that are acidic and are therefore highly protein bound (e.g., phenytoin, salicylate, bupivacaine, barbiturates, antibiotics, theophylline, and diazepam). In addition, some medications, such as phenytoin, salicylate, sulfisoxazole, caffeine, ceftriaxone, diatrizoate (Hypaque), and sodium benzoate, compete with bilirubin for binding to albumin (see E-Fig. 7.2 ). If large amounts of bilirubin are displaced, particularly in the presence of hypoxemia and acidosis, which open the blood-brain barrier (BBB), kernicterus may result. a
a References .
Because these metabolic derangements often occur in sick neonates coming to surgery, special care must be taken when selecting medications for the anesthetic. Medications that are basic (e.g., lidocaine or alfentanil) are generally bound to plasma α 1 -acid glycoprotein (AAG); AAG concentrations in preterm and term infants are reduced but are similar to those in adults by 6 months, although between patient variability is high (e.g., AAG 0.32–0.92 g/L). Therefore for a given dose, the free fraction of a drug is greater in preterm and term infants. In contrast to drugs bound to plasma proteins, unbound lipophilic drugs passively diffuse across the BBB, equilibrating very quickly. This may contribute to bupivacaine's propensity for producing seizures in neonates. Decreased protein binding, as in the neonate, results in a greater proportion of unbound drug that is available for passive diffusion.


 but would be of minimal importance for drugs that have low protein binding (e.g., ampicillin).")
These binding changes in neonates differ from adults in whom protein binding changes are important for the relatively unusual case of a drug that is more than 95% protein bound, with a high extraction ratio and a narrow therapeutic index, that is given parenterally (e.g., IV lidocaine), or a drug with a narrow therapeutic index that is given orally and has a very rapid T 1/2 keo (e.g., antiarrhythmic drugs; propafenone, verapamil).
Maturational changes in tissue binding also affect drug distribution. Myocardial digoxin concentrations in infants are 6-fold greater than those in adults, despite similar serum concentrations. Erythrocyte/plasma concentration ratios of digoxin in infants are one-third smaller during loading digitalization than during maintenance digoxin therapy. These findings are consistent with a greater Vd of digoxin in infants and may explain, in part, the unusually large therapeutic doses needed in infants.
Preterm and term infants have a much greater proportion of body weight in the form of water than do older children and adults ( Fig. 7.8 ). The net effect on water-soluble medications is a greater Vd in infants, which in turn increases the initial (loading) dose, based on weight, to achieve the desired target serum concentration and clinical response. Term neonates often require a greater loading dose (milligrams per kilogram) for some medications (e.g., digoxin, succinylcholine, and aminoglycoside antibiotics) than older children. However, neonates also tend to be sensitive to the respiratory, neurologic, and circulatory effects of many medications and therefore tend to be more responsive to these effects at reduced blood concentrations than are children and adults. Preterm infants are usually more sensitive than term neonates and in general require even smaller blood concentrations. On the other hand, dopamine may increase blood pressure (BP) and urine output in term neonates only at doses as large as 50 µg/kg per minute. This dose, which would induce intense vasoconstriction in adults, suggests that neonates are less sensitive in their cardiovascular responsiveness. It is important to carefully titrate the doses of all medications that are administered to preterm and term infants to the desired response.
 and may account for the large (by weight) loading dose required for some medications to achieve a satisfactory clinical response.")
Compared with children and adolescents, preterm and term neonates have a smaller proportion of body weight in the form of fat and muscle mass; with growth, the proportion of body weight composed of these tissues increases ( Fig. 7.9 ). Therefore medications that depend on their redistribution into muscle and fat for termination of their clinical effects likely have a larger initial peak blood concentration. These medications may also have a more sustained blood concentration because neonates have less tissue for redistribution of these medications. An incorrect dose may result in prolonged undesirable clinical effects (e.g., barbiturates and opioids may cause prolonged sedation and respiratory depression). The possible influence of small muscle mass on the response to NMBDs is exemplified by achieving neuromuscular blockade at smaller serum concentrations in infants.
 and muscle (e.g., fentanyl) because there is less tissue mass into which the drug may redistribute.")
There are differences in relative organ mass and regional blood flow that change with growth and development during the first few months of life in addition to physiologic changes at birth. Kidney and brain receive an increasing proportion of the cardiac output, while the proportion to the liver decreases. The proportional mass of the head and liver are much greater in the infant than in the adult. Mean CBF peaks in early childhood (70 mL/minute per 100 g) at about 3–8 years of age ; flows in both neonates and adults are less (50 mL/minute per 100 g). The highly lipophilic drugs used for anesthetic induction rapidly achieve concentration equilibrium with brain tissue, but the reduced cerebral perfusion means that onset time after IV induction is slower in neonates that in early childhood. Offset time is also delayed because redistribution to the well-perfused and deep, underperfused tissues is less.
The BBB is a network of complex tight junctions between specialized endothelial cells that restricts the paracellular diffusion of hydrophilic molecules from the blood to the brain substance. There are specific transport systems selectively expressed in the barrier endothelial cell membranes that mediate the transport of nutrients into the central nervous system (CNS) and of toxic metabolites out of the CNS. Small molecules can cross into fetal and neonatal brains more readily than they do into adult brains. BBB function improves throughout fetal brain development, reaching maturity at term. This maturation explains why kernicterus is more common in the preterm than the term neonate. BBB breakdown or alterations in transport systems may occur in some diseases. Proinflammatory substances and specific disease-associated proteins often mediate BBB dysfunction. Fentanyl is actively transported across the BBB by a saturable adenosine triphosphate (ATP)-dependent process, while ATP-binding cassette proteins such as P-glycoprotein actively pump out opioids such as fentanyl and morphine. P-glycoprotein modulation significantly influences brain opioid distribution and onset time and magnitude and duration of analgesic response. Modulation may occur during disease processes, increased temperature, or other substances (e.g., verapamil, magnesium). Genetic polymorphisms affecting P-glycoprotein–related genes may explain some individual differences in CNS-active drug sensitivity (see also Chapter 6 ).
Anesthetic drugs are mainly administered through the IV and inhalational routes, although premedication and postoperative pain relief is commonly administered enterally. Drug absorption after oral administration is slower in neonates than in children because of delayed gastric emptying ( Fig. 7.10 ).

Adult enteral absorption rates may not be reached until 6 to 8 months after birth. Congenital malformations (e.g., duodenal atresia), co-administration of drugs (e.g., opioids), or disease characteristics (e.g., necrotizing enterocolitis) may further affect the variability in absorption. Delayed gastric emptying and reduced clearance may dictate reduced doses and frequency of repeated drug administration. For example, a mean steady-state target acetaminophen concentration greater than 10 mg/L at trough can be achieved by an oral dose of 25 mg/kg per day in preterm neonates at 30 weeks, 45 mg/kg per day at 34 weeks, and 60 mg/kg per day at 40 weeks PMA. Because gastric emptying is slow in preterm neonates, dosing may only be required twice a day. In contrast, the rectal administration of some drugs (e.g., thiopental, methohexital) is more rapid in neonates than adults. However, the interindividual absorption and relative bioavailability (F) variability after rectal administration may be more extensive compared with oral administration, making rectal administration less suitable for repeated administration. The frequent passage of stools in the neonate may render suppository use ineffective. Variable absorption and bioavailability has resulted in respiratory arrest when repeat opioids are administered by the rectal route to children.
The larger relative skin surface area, increased cutaneous perfusion, and thinner stratum corneum in neonates increase systemic exposure of topical drugs (e.g., corticosteroids, local anesthetic creams, antiseptics). Neonates have a greater tendency to form methemoglobin because of reduced methemoglobin reductase activity compared with older children. Furthermore, fetal hemoglobin is more readily oxidized by drugs such as prilocaine compared with adult hemoglobin. Combined with an increased transcutaneous absorption, these have resulted in reluctance to apply repeat or large surface area application of topical local anesthetics, such as EMLA (eutectic mixture of local anesthetics [lidocaine-prilocaine]) cream, in this age group. Similarly, cutaneous application of iodine antiseptics in neonates may result in transient hypothyroidism.
The intramuscular (IM) route is frowned upon in children. Although bioavailability is high and approaches unity for most drugs, absorption is delayed compared to the IV route. Ketamine, however, remains popular, and peak concentrations are reached within 10 minutes after 4 mg/kg.
Exploration of alternative delivery routes in young children has centered on the nasal passages. Nasal diamorphine 0.1 mg/kg, used in the United Kingdom for forearm fracture pain in the emergency room, is rapidly absorbed as a nasal spray in 0.2 mL of sterile water, with peak morphine plasma concentrations (Tpeak) occurring at 10 minutes. Nasal S-ketamine (2 mg/kg) results in peak plasma concentrations of 355 ng/mL within 18 minutes. Nasal fentanyl (150 µg/mL) 1.5 µg/kg given to children (3–17 years) for fracture pain resulted in good analgesia; peak concentrations occurred at 13 minutes. There remain concerns that intranasal drugs may pass through the posterior nasopharynx or irritate the vocal cords.
Advances in aerosol delivery devices have improved dosing accuracy. Administration of ketorolac (15 mg [weight 30–50 kg] or 30 mg [weight >50 kg]) to adolescents by the intranasal route resulted in a rapid increase in plasma concentration (time to peak concentration was 52 ± 6 minutes) and may be a useful therapeutic alternative to IV injection. A target concentration of 0.37 mg/L in the effect compartment was achieved within 30 minutes and remained above that target for 10 hours. The nasal passages change with age and so it would not be surprising if absorption by that route did not also change with age. Drug combinations may show benefits over single-drug therapy. Formulations containing two drugs may improve analgesia by additivity while decreasing adverse effects.
Buccal and sublingual administration, like the nasal route, offer ease of administration, rapid systemic absorption, and avoidance of hepatic first-pass metabolism. Midazolam administered by the buccal surface is now more popular than rectal administration for the acute management of seizures.
The oral biovailability of a drug may be affected by (1) interactions with food when feeding is frequent in the neonate (e.g., phenytoin ), (2) use of adult formulations that are divided or altered for pediatric use (nizatidine ), and (3) lower cytochrome P450 enzyme activity in the intestine. The last factor may cause an increased bioavailability of midazolam because CYP3A activity is reduced. The use of drug vials designed for adult use may result in dose inaccuracy when proportioned for pediatric use, causing a relative increase or decrease in assumed bioavailability.
Dose accuracy is lost when buccal and sublingual administration is attempted because those routes require prolonged exposure to the mucosal surface. Infants find it difficult to hold the drug in their mouth for the requisite retention time (particularly if taste is unfavorable) and this results in more swallowed drug or drug spat out than in adults. If the drug has a high first-pass effect, then the lower relative bioavailability results in lower plasma concentrations. Although many analgesics are available in an oral liquid formulation, taste is a strong determinant of compliance and unpalatable preparations may be refused. Taste preferences change with age.
First-pass effect impacts bioavailability and contribution of active metabolites to effect. The oral bioavailability of clonidine is low (F = 0.55) in children 3 to 10 years of age. Consequently, larger oral doses of clonidine (per kilogram) are required when this formulation is used to achieve concentrations similar to those reported in adults. Oral absorption is slow (absorption half-time 0.45 hours), and peak concentrations are not reached until 1 hour. Similarly, oral ketamine needs to be given in doses of up to 10 mg/kg to achieve therapeutic effect in children 1 to 8 years of age who have suffered burns. Not only was bioavailability reduced (F = 0.45) but absorption was also slow; absorption half-time was 59 minutes, and between-subject variability in this cohort was substantive. Analgesic effect, however, may be supplemented by the increased concentration of the active metabolite norketamine.
The main routes by which drugs and their metabolites leave the body are the hepatobiliary system, the kidney, and the lung. Microsomal enzyme activity can be classified into three groups :
Mature at birth but decreasing with age (e.g., CYP3A7 responsible for methadone clearance in neonates)
Mature at birth and sustained through to adulthood (e.g., plasma esterases that clear remifentanil)
Immature at birth
The last group accounts for the majority of enzymatic activity; the concentrations, and activities of many microsomal enzymes are reduced or absent in the neonate.
The liver is the most important organ in drug metabolism. Hepatic enzymatic drug metabolism usually converts the medication from a less polar state (lipid-soluble) to a more polar, water-soluble compound (see later discussion). The enzyme activities responsible for drug clearance are reduced in the neonate. However, clearance depends on enzyme activity, organ blood flow, and organ size; these change independently with age. Half-life is often used to describe maturation. The elimination half-lives of diazepam, thiopental, and phenobarbital are markedly increased in neonates compared with adults (i.e., the elimination half-life for thiopental in the neonate [17.9 hours] is almost three times that in children [6.1 hours] and 50% greater than that in adults [12 hours]) ( E-Fig. 7.3 ). In general, the half-lives of medications that are eliminated by the liver are prolonged in neonates, decreased in children 4 to 10 years of age, and reach adult values in adolescents, mirroring clearance changes with age (see Fig. 7.5 ). Half-life is confounded by clearance (CL) and volume (Vd); both change independently with age.

Consequently, clearance is a better parameter to gauge maturation.
Some medications are extensively metabolized by the liver or other organs (e.g., the intestines or lungs) and are referred to as having high extraction ratios. This extensive metabolism produces a “first-pass” effect in which a large proportion of an enteral dose is inactivated as it passes through the organ before reaching the systemic circulation (e.g., propranolol, morphine, and midazolam). Clearance of these drugs is commonly termed “perfusion limited.” In contrast, drugs with low intrinsic clearance (diazepam, phenytoin, aspirin) are termed “capacity limited.”
Metabolism via cytochrome P-450 in the intestinal wall may also occur during drug absorption. Competition between drugs for these intestinal wall enzymes may increase the bioavailability of one drug over another. The relative bioavailability of phenylephrine was increased when coadministered with acetaminophen owing to competition for gut wall sulfate conjugation. Certain foods (e.g., grapefruit juice) may also induce or inhibit intestinal cytochromes, resulting in food–drug interactions. The concentrations of these enzymes in neonates are less than in older children. These enzymes may also be affected by diseases such as cystic fibrosis or celiac disease.
The opening or closing of a patent ductus may have profound effects on drug delivery to metabolizing organs in preterm infants. The ability to metabolize and conjugate medications improves considerably with age as a result of both increased enzyme activity and increased delivery of drug to the liver. Other factors influence the rate of hepatic maturation and metabolism (e.g., sepsis and malnutrition may slow maturation, whereas previous exposure to anticonvulsants, such as phenytoin or phenobarbital, may hasten maturation).
Metabolism through biotransformation to more polar forms is required for many drugs before they can be eliminated. Two types of drug biotransformation can occur: phase I and phase II reactions. Phase I reactions transform the drug via oxidation, reduction, or hydrolysis. Phase II reactions transform the drug via conjugation reactions, such as glucuronidation, sulfation, and acetylation, into more polar forms. Hepatic drug metabolism activity appears as early as 9 to 22 weeks gestation, when fetal liver enzyme activity may vary from 2% to 36% of adult activity. It is inaccurate to generalize that the preterm neonate cannot metabolize drugs; rather, the specific pathway(s) of drug metabolism must be considered.
Metabolism of many drugs involves the cytochrome P-450 (CYP) enzyme system. Multiple isoforms of the CYP enzyme system exist with different substrate specificities for different drugs. Induction and inhibition of these enzymes by different drugs and chemicals requires a thorough understanding of both the nomenclature of the CYP system, as well as the specific isoforms responsible for metabolism of the drugs used in pediatric anesthesia. There are both genetic and ethnic polymorphisms that may lead to clinically important differences in the capacity to metabolize drugs; these differences can make individual drug responses in some cases unpredictable. Epigenetics is a young and new area of research that examines variable but heritable differences in gene expression without modifications to the DNA sequence. This subject is discussed further in Chapter 6 .
CYPs are heme-containing proteins that provide most of the phase I drug metabolism for lipophilic compounds in the body. The generally accepted nomenclature of the cytochrome P-450 isozymes begins with CYP, and group enzymes with more than 36% DNA homology subgrouped into families designated with an Arabic number, followed by letters for the subfamily of closely related proteins (>77% homology), followed by a number for the specific enzyme gene, such as CYP3A4. Isozymes that are important in human drug metabolism are found in the CYP1, CYP2, and CYP3 gene families. Table 7.1 outlines the CYP isozymes and their common substrates.
| Enzymes | Selected Substrates | Inducers | Inhibitors | Developmental Changes |
|---|---|---|---|---|
| CYP1A2 | Acetaminophen, caffeine, theophylline, warfarin | Cigarette smoke, charcoal-broiled meat, omeprazole, cruciferous vegetables | α-Naphthoflavone | Not present to an appreciable extent in human fetal liver. Adult levels reached by 4 months of age and may be exceeded in children 1–2 years of age. Inhibited by phenobarbital and phenytoin. |
| CYP2A6 | Warfarin, nicotine | Barbiturates | Tranylcypromine | |
| CYP2C9 | Diclofenac, phenytoin, torsemide, S -warfarin tolbutamide | Rifampin | Sulfaphenazole, sulfinpyrazone | Not apparent in fetal liver. Inferential data using phenytoin disposition as a nonspecific pharmacologic probe suggests low activity during the first week of life, with adult activity reached by 6 months of age and peak activity reached by 3–4 years of age. Metabolism induced by rifampin and phenobarbital and inhibited by cimetidine. |
| CYP2C19 | Phenytoin, diazepam, omeprazole, propranolol | Rifampin | Tranylcypromine | |
| CYP2D6 | Amitriptyline, captopril, codeine, dextromethorphan, fluoxetine, hydrocodone, ondansetron, propafenone, propranolol, timolol | None known | Fluoxetine, quinidine | Low to absent in fetal liver but uniformly present at 1 week of postnatal age. Poor activity (approximately 20% of adult values) at 1 month of postnatal age. Adult competence reached by 3–5 years of age. Metabolism inhibited by cimetidine. |
| CYP3A4 | Acetaminophen, alfentanil, amiodarone, budesonide, carbamazepine, diazepam, erythromycin, lidocaine, midazolam, nifedipine, omeprazole, cisapride, theophylline, verapamil, R -warfarin | Carbamazepine, dexamethasone, phenobarbital, phenytoin, rifampin | Azole antifungals, ethinyl estradiol, naringenin, troleandomycin, erythromycin | CYP3A4 has low activity in the first month of life, which approaches adult levels by 6–12 months postnatally. |
| CYP3A7 | Dehydroepiandrosterone, ethinyl estradiol, various dihydropyrimidines | Carbamazepine, rifampin, phenytoin, dexamethasone, phenobarbital | Azole antifungals, erythromycin, cimetidine | CYP3A7 is functionally active in the fetus; approximately 30% to 75% of adult levels of CYP3A4. |
For many drugs, the reduced metabolism in neonates relates to reduced total quantities of CYP enzymes in the hepatic microsomes. Although the concentrations of CYP enzymes increase with gestational age, they may reach only 50% of adult values at term. Most isozymes are immature in the neonate, but some CYP isozymes exhibit near-adult activity, whereas others produce unique metabolic pathways in the neonatal period that invalidate broad generalizations about neonatal drug metabolism (see Table 7.1 ). Developmental changes of specific cytochromes are discussed in Chapter 6 .
The other major route of drug metabolism, designated phase II reactions, involves synthetic or conjugation reactions that increase the hydrophilicity of molecules to facilitate renal elimination. The phase II enzymes include glucuronosyltransferase, sulfotransferase, N -acetyltransferase, glutathione S -transferase, and methyltransferase. The phase II enzymes also show developmental changes during infancy that influence drug clearance ( Table 7.2 ).
| Enzymes | Selected Substrates | Developmental Patterns |
|---|---|---|
| Uridine diphosphoglucuronyltransferase (UDP-GT) | Chloramphenicol, morphine, acetaminophen, valproic acid, lorazepam | Ontogeny is isoform specific. In general, adult activity is achieved by 6–18 months of age. May be induced by cigarette smoke and phenobarbital. |
| Sulfotransferase | Bile acids, acetaminophen, cholesterol, polyethylene, glycols, dopamine, chloramphenicol | Ontogeny seems to be more rapid than UDP-GT; however, it is substrate specific. Activity for some isoforms may exceed adult values during infancy and childhood (e.g., that responsible for acetaminophen metabolism). |
| N -Acetyltransferase 2 | Hydralazine, procainamide, clonazepam, caffeine, sulfamethoxazole | Some fetal activity present by 16 weeks. Virtually 100% of infants between birth and 2 months of age exhibit the slow metabolizer phenotype. Adult activity present by 1–3 years of age. |
Most conjugation reactions have limited activity during fetal development. One of the most familiar synthetic reactions in young infants involves conjugation by uridine diphosphoglucuronosyltransferases (UGTs). This enzyme system includes numerous isoforms and is also responsible for glucuronidation of endogenous compounds, such as bilirubin (by UGT1A1). As with the maturation of bilirubin conjugation, UGT activity is limited immediately postnatally and the different isoforms mature at different rates postnatally. Dosage adjustments are often needed to avoid toxicity in neonates from drugs that require conjugation by UGT for clearance. Experience with chloramphenicol in the 1960s illustrated this lesson when neonates received standard pediatric doses of chloramphenicol without understanding the immaturity of UGT and its role in the elimination of chloramphenicol. Infants accumulated large concentrations of chloramphenicol and developed fatal circulatory collapse, a condition known as the gray baby syndrome. Although the clearance of chloramphenicol is poor during the neonatal period, appropriate dosage adjustments and monitoring allow safe treatment of preterm and term infants with chloramphenicol.
Morphine, acetaminophen, dexmedetomidine, and lorazepam also undergo glucuronidation. The major steps in the metabolic disposition of morphine in children and adults is glucuronidation in the 3- and 6-position. The limited ability of neonates to metabolize morphine by glucuronidation necessitates dosage adjustment. Detailed studies have shown that morphine clearance, in particular 3- and 6-glucuronide formation, is limited at birth and increases with birth weight, gestational age, and postnatal age. In some studies, morphine clearance, expressed as per kilogram, approaches adult values by 1 month, although others reported that clearance does not reach adult values until at 5 to 6 months. Overall, the maturation of glucuronosyltransferase enzymes varies among isoforms but, in general, adult activity is reached by 6 to 18 months of age. Some of the confusion relating to maturation rates is attributable to the use of the per-kilogram size model. The use of allometry with a maturation model has assisted understanding. The time courses of maturation of drug metabolism for morphine, acetaminophen, dexmedetomidine, and GFR are strikingly similar ( Fig. 7.11 ) with 50% of size-adjusted adult values reached between 8 and 12 weeks ( TM 50 ) after full-term delivery. All three drugs are cleared predominantly by UGT that converts the parent compound into a water-soluble metabolite that is excreted by the kidneys; the clearance maturation profiles of these drugs matches that of GFR maturation. Glucuronidation is also the major metabolic pathway of propofol metabolism, although multiple CYP isoenzymes, including CYP2B6, CYP2C9, or CYP2A6, contribute to its metabolism and cause a faster maturation profile than expected from glucuronide conjugation alone. A phase I reaction (CYP3A4) is the major enzyme system for oxidation of levobupivacaine, and clearance through this pathway is faster than those associated with UGT maturation.
 plays a major role. These profiles are closely aligned with glomerular filtration rate ( GFR ). In contrast, cytochrome P-450 isoenzymes also contribute to propofol and levobupivacaine metabolism and cause a faster maturation profile than expected from glucuronide conjugation alone. Hill , Hill coefficient; TM 50 , maturation half-time.")
In contrast to glucuronosyltransferase, the sulfotransferase enzyme system is well developed in the neonate, and for some compounds it may compensate for limited glucuronidation. In adults, the primary pathway for acetaminophen metabolism is glucuronidation, yet its half-life is only moderately prolonged in neonates compared with older infants and adults. This occurs partly because of the increased Vd in neonates ( Eq. 7.20 ) and partly because the neonate forms more sulfate than glucuronide conjugate, leading to a greater percent of the dose excreted as the acetaminophen-sulfate conjugate. Unfortunately, this does not confer safety from hepatotoxicity. The toxic metabolite is created through the oxidative pathway mediated by CYP2E1.
Transition from the intrauterine to the extrauterine environment is associated with major changes in blood flow. There may also be an environmental trigger for the expression of some metabolic enzyme activities, resulting in a slight increase in maturation rate above that predicted by PMA. Many biotransformation reactions, especially those involving certain forms of CYP, are inducible before birth through maternal exposure to drugs, cigarette smoke, or other inducing agents. Postnatally, biotransformation reactions may be induced through drug exposure (see Tables 7.1 and 7.2 ) and may be slowed by hypoxia, asphyxia, organ damage, and/or illness. The reduced thiopental clearance estimated from data when the drug was given to control neonatal seizures that resulted from hypoxic-ischemic insults may not be applicable to healthy neonates undergoing anesthesia.
Many drugs undergo metabolic clearance at extrahepatic sites. Remifentanil and atracurium are degraded by nonspecific esterases in tissues and erythrocytes. Clearance, expressed per kilogram, is increased in younger children, likely attributable to size, because clearance is similar when scaled to a 70-kg person using allometry. Nonspecific blood esterases that metabolize remifentanil are mature at birth.
Ester local anesthetics are metabolized by plasma butyrylcholinesterase, which is thought to be reduced in neonates. The in vitro plasma half-life of 2-chloroprocaine in umbilical cord blood is twice that in maternal blood, but there are no in vivo studies of the effects of age on its metabolism. Succinylcholine clearance is increased in neonates when expressed as per kilogram, suggesting butyrylcholinesterase activity is mature at birth.
Renal function in preterm and term infants is less efficient than in adults, even after adjusting for the differences in body weight. This reduced efficiency is related to the combination of incomplete glomerular development, low perfusion pressure, and inadequate osmotic load to produce full countercurrent effects. However, glomerular filtration and tubular function both develop rapidly during the first few months of life, and are nearly mature by 20 weeks of age, and fully mature by 2 years of age ( Figs. 7.11 and 7.12 ). For these reasons, drugs that are excreted primarily through glomerular filtration or tubular secretion, such as aminoglycoside and cephalosporin antibiotics, have a prolonged elimination half-life in neonates ( E-Fig. 7.4 ).


In the presence of renal failure, one or two doses of drugs that are excreted via the kidneys often achieve and maintain prolonged therapeutic drug concentrations if there is no alternate pathway of excretion. Whenever administering a medication to a preterm or term infant, one must consider the contribution of renal function in the clearance of both the drug and any active metabolite.
The PK and PD of the old muscle relaxant, curare, exemplify the complex interaction of increased Vd, smaller muscle mass, and decreased rate of excretion as a result of immaturity of glomerular filtration. The initial dose (per kilogram) of curare needed to achieve neuromuscular blockade is similar in infants and adults. In infants, however, this blockade is achieved at reduced serum concentrations compared with older children or adults, corresponding to differences in muscle mass and receptor immaturity. A larger Vd (total body water) accounts for the equivalent dose for each kilogram of body weight, and the reduced glomerular function in infants compared with older children or adults accounts in part for the longer duration of action. As in the case of drugs excreted by the liver, there is a triphasic developmental response to drugs excreted by the kidneys when expressed as per kilogram (see Fig. 7.5 ): a prolonged half-life in neonates (immature renal function), a shortened half-life in young children, and a greater elimination half-life in adolescents and adults (size-related).
Reduced protein binding in neonates and preterm infants increases the free fraction of drugs delivered to the kidneys and liver for metabolism; however, reduced clearance results in a greater potential for toxicity. An important example is the immature clearance of bupivacaine, which resulted in large plasma concentrations that increased sufficiently to cause seizures in neonates treated with epidural infusions at rates greater than that at which it was metabolized.
Laboratory data have demonstrated that the lethal dose in 50% of neonatal animals (LD 50 ) for many drugs depends on age: the LD 50 is significantly less in neonatal than in adult animals. The sensitivity of human neonates to most of the sedatives, hypnotics, and opioids is clinically well known and may in part be related to increased brain permeability (immature BBB or damage to the BBB) for some medications. Laboratory studies have demonstrated greater brain concentrations of morphine and amobarbital in infant than in adult animals.
However, respiratory depression, measured by CO 2 response curves or arterial oxygen tension, is similar from 2 to 570 days after birth at the same morphine blood concentration. Altered PK may contribute to the increased sensitivity to morphine in neonates. A reduced clearance and a reduced Vd in neonates will result in greater plasma concentrations in this age group compared with older children given similar weight-scaled doses, and this greater concentration contributes more to respiratory depression than the increased brain permeability in those who were not premature.
Drugs that are not particularly lipid soluble may enter the brain more easily in neonates with incomplete myelination than in infants where the BBB is intact. When considering the use of any centrally acting medication in children younger than 1 year of age, and particularly those less than 48 weeks PMA, one must balance the potential risks and benefits. The dose must be carefully calculated and titrated to the minimum dose that achieves the desired response. Careful monitoring of vital signs is critical because prolonged effects or adverse clinical responses may occur in children at any age, but particularly in infants in whom CNS maturation may be incomplete.
Children's responses to drugs have much in common with the responses in adults. The perception that drug effects differ in children may be attributed to the patchy study of drugs in pediatric populations who have size- and maturation-related effects, as well as different diseases. Neonates and infants, however, often have altered PD. For example, the increased sensitivity of the neonate to morphine compared with children may be attributable, in part, to altered PK (reduced clearance, smaller Vd), but it may also be a reflection of the developmental regulation of opioid receptors.
The MAC for most inhalational anesthetics is less in neonates than in infants, which in turn is greater than that observed in children and adults. The MAC of isoflurane in preterm neonates less than 32 weeks gestation is 1.28%, and that in neonates 32 to 37 weeks gestation is 1.41%. This value increases to 1.87% by 6 months of age before decreasing again throughout childhood. The cause of these age-related differences is uncertain and may relate to maturational changes in cerebral blood flow (CBF), γ-aminobutyric acid (GABA) class A receptor numbers, or developmental shifts in the regulation of chloride transporters.
Neonates have an increased sensitivity to the effects of NMBDs. The reason for this is unknown, but it is consistent with the observation that there is a 3-fold reduction in the release of acetylcholine from the infant rat phrenic nerve as well as a relatively reduced muscle mass. The increased Vd, however, means that a single NMBD dose (calculated as milligrams per kilogram) in the neonate results in blockade at a reduced plasma concentration while the decreased clearance prolongs the duration of effect.
Both the coagulation and the fibrinolytic systems are immature at birth. Consequently, the target plasma concentration of antifibrinolytic drugs required to achieve similar effects in neonates is less than that in adults. Although the concentration of ε-aminocaproic acid (EACA) required to inhibit fibrinolysis in adult plasma in vitro is 130 mg/L, the concentration required in neonatal plasma is much smaller, 50 mg/L. The dose of EACA must be adjusted in neonates because of both the immaturity of their antifibrinolytic clearance pathways and the coagulation cascade.
Cardiac calcium stores in the endoplasmic reticulum are reduced in the neonatal heart because of immaturity. Exogenous calcium has greater impact on contractility in this age group than in older children and adults. Conversely, neonates may suffer cardiac arrest if given the calcium antagonist, verapamil. Immaturity of myocardial potassium channels prolongs the QT interval in neonates; neonates exhibit a greater sensitivity toward QTc (corrected QT) interval prolongation compared with older children. This made them more sensitive to sotalol given for supraventricular tachycardia (SVT).
Amide local anesthetic agents induce blocks of briefer duration and require a larger weight-scaled dose to achieve similar dermatomal levels when given by subarachnoid block to infants. This may be due, in part, to myelination, spacing of the nodes of Ranvier, the length of nerve exposed, increased relative volume of CSF, as well as other size factors. There is an age-dependent expression of intestinal motilin receptors and the modulation of gastric antral contractions in neonates. Prokinetic agents may not be useful in very preterm infants, partially useful in older preterm infants, and useful in full-term infants. Similarly, bronchodilators in infants are less effective because of the paucity of bronchial smooth muscle that can cause bronchospasm.
Drug effects in neonates may not be evident until later in life. Neonates and young children may suffer permanent effects resulting from a stimulus applied at a sensitive point in development. For example, congenital hypothyroidism, if untreated, causes lifelong phenotypic changes. The incidence of vaginal carcinoma in children of mothers treated with stilboestrol during pregnancy is great.
Corticosteroids are associated with growth retardation in children with asthma. There are concerns that neonatal exposure to some anesthetic agents (e.g., ketamine, midazolam) may cause widespread neuronal apoptosis and long-term memory deficits (see Chapter 25 ).
Outcome measures are more difficult to assess in neonates and infants than in children or adults. Measurement techniques, disease and pathology differences, inhomogeneous groups, recruitment issues, ethical considerations, and endpoint definitions for establishing efficacy and safety often confuse interpretation of the measures.
Common effects measured in infancy include anesthesia depth, pain responses, depth of sedation, and intensity of neuromuscular blockade. A common effect measure used to assess depth of anesthesia is the EEG or a modification of detected EEG signals (spectral edge frequency, bispectral index [BIS], entropy). Physiologic studies in adults and children indicate that EEG-derived anesthesia depth monitors can provide an imprecise and drug-dependent measure of arousal. Although the outputs from these monitors do not closely represent any true physiologic entity, they can be used as guides for anesthesia, and in so doing, may improve outcomes in adults. In older children the physiology, anatomy, and clinical observations indicate the performance of the monitors may be similar to that in adults. In infants, however, their use cannot be supported in theory or in practice at this time. During anesthesia, the EEG in infants is fundamentally different from the EEG in older children; there remains a need for specific neonate-derived algorithms if EEG-derived anesthesia depth monitors are to be used in neonates. Examples of problems with BIS monitoring in infants and young children include the observations that BIS numbers paradoxically increase when sevoflurane concentrations exceed 3% (1.2 × MAC), there is often a difference between the right and left sides of the brain, equivalent MAC values yield different BIS values with each agent, and values in children tend to be greater than those in adults at equivalent MAC values (see also Chapter 52 ).
The Children's Hospital of Wisconsin Sedation Scale has been used to investigate ketamine in the emergency department. However, despite the use of such scales in procedural pain or sedation studies, few behavioral scales have been adequately validated in this setting and interobserver variability can be substantial. Most scores are validated for the acute, procedural setting and are less robust for subacute or chronic pain or stress.
The goal of treatment is the target effect. A PD model is used to predict the target concentration given a target effect. Population estimates for the PD model parameters and covariate information are used to predict typical PD values in a specific patient. Population estimates of PK model parameter estimates and covariate information are then used to predict typical PK values in a typical patient. For example, a dexmedetomidine steady-state target concentration of 0.6 µg/L may be achieved with an infusion of 0.33 µg/kg per hour in a neonate, 0.51 µg/kg per hour in a 1-year-old, and 0.47 µg/kg per hour in an 8-year-old. This target concentration strategy is a powerful tool for determining the clinical dose. Monitoring the drug concentrations in serum and Bayesian forecasting may be used to improve the dose in individual patients.
This target effect approach is intrinsic to pediatric anesthesiologists using target-controlled infusion systems (see also Chapter 8 ). These devices target a specific plasma or effect-site concentration in a typical individual and this concentration is assumed to have a typical target effect. The target concentration is one that achieves a target therapeutic effect (e.g., anesthesia) without excessive adverse effects (e.g., hypotension). Unfortunately, these devices have still not been approved by the Food and Drug Administration (FDA) for use in the United States.
An effect-site target concentration has been estimated for many drugs used in anesthesia, analgesia, and sedation. For example, a propofol target concentration of 3 mg/L or 3 µg/mL in a typical patient can be achieved using preprogrammed target-controlled infusion devices. In teenagers, a BIS monitor can provide feedback to guide the infusion rate to achieve a desired target effect in the particular individual. The luxury of such a feedback system is not available for most drugs and unfortunately may be of little value in neonates and infants.
A target concentration of 10 µg/L may be used for morphine analgesia. Observations in children after cardiac surgery found that steady-state serum concentrations greater than 20 µg/L resulted in hypercarbia (Pa co 2 [partial pressure of carbon dioxide in arterial blood] >55 mm Hg) and flattened CO 2 response curves. During wash-out, morphine concentrations in excess of 15 µg/L caused hypercarbia in 46% of children, whereas concentrations less than 15 µg/L were associated with hypercarbia in only 13%. No age-related differences in the respiratory effect occurred at the same serum concentration of morphine. Observation or self-reporting pain scales are used as part of the feedback loop for dose incremental changes.
The target concentration may vary depending on the desired target effect. The target concentration for ketamine analgesia (0.25 mg/L) differs substantially from that of anesthesia (2 mg/L), and BIS monitoring would be totally useless because ketamine causes central excitation, thereby increasing bispectral monitoring numbers.
There are many common examples of drug interactions that increase or decrease responses mediated through either PK or PD routes. Phenobarbital induction of CYP3A4 metabolism and consequent increased ketamine requirements for radiologic sedation is an example of a PK interaction. PK interactions are often dealt with in mixed-effects modeling by including the effect of a second drug as a covariate on affected PK parameters such as those describing clearance (CL), volume of distribution (Vd), or bioavailability (F). The midazolam-propofol PK interaction has been investigated by adjusting midazolam CL and V using propofol plasma concentrations included in an exponential covariate model—that is,
where CL is clearance from the central compartment, for the population (CL POP ) and the individual (CL IND ). Here, the effect of plasma propofol concentration (C PROP ) on the CL parameter is estimated (the parameter “cov”) and scaled to the population median C PROP .
Interactions may also occur at entry into the effect site. An increase in the T 1/2 keo of d -tubocurarine with increasing inspired concentrations of halothane has been reported. Halothane is a negative inotrope and reduces skeletal muscle blood flow, so it is reasonable to interpret changes in T 1/2 keo as a result of changes in organ blood flow.
Competitive antagonists reduce receptor availability by competing for occupancy at the same receptor site. Drugs that elicit an effect are called agonists, while those that do not are called antagonists, so the occupancy of some receptors by the antagonists results in less effect. In general, competitive antagonists shift the effect-concentration curve to the right by altering the C 50 . The Emax equation ( Eq. 7.19 ) can then be expressed as
where Ce is the concentration in the effect site, and A and EA 50 represent ligand A concentration and potency. Noncompetitive antagonists shift the observed maximum effect (Emax) rather than the C 50 :
PD interactions are not restricted to same-site binding interactions; some proteins have multiple binding sites, and ligands binding at these sites can also alter the above relationship (i.e., through changes in protein conformation that lead to downstream changes or modulate agonist-receptor affinity). These are referred to as “allosteric” interactions. Action at a receptor level may be studied in vivo. Several techniques exist for evaluating pharmacodynamic interactions in vivo.
Anesthetic drug interactions traditionally have been characterized using isobolographic analysis or multiple logistic regression. Minto and Greco proposed models based on response-surface methodology (see Chapter 8 ). Computer simulations based on interactions at the effect site predicted that the maximally synergistic three-drug combination (midazolam, propofol, and alfentanil) tripled the duration of effect compared with propofol alone. The response surface for ibuprofen and acetaminophen is shown in Fig. 7.13 . The addition of acetaminophen to ibuprofen improved analgesia when the dose of ibuprofen was less than 100 mg (5 mg/kg) in a 5-year-old child. Response surfaces can describe anesthetic interactions, even those between agonists, partial agonists, competitive antagonists, and inverse agonists.

Inhalation anesthetic agents can prolong the duration of block, and this effect is agent specific. When compared with halothane, sevoflurane potentiates the effects of vecuronium to a greater extent. When compared with balanced anesthesia, sevoflurane and halothane decrease the dose requirements of vecuronium by 60% and 40%, respectively.
Surface modeling techniques have been used to demonstrate strikingly synergistic effects from sevoflurane with alfentanil and remifentanil with propofol on respiration in adults. It is little wonder that the use of three or more sedating medications is associated with significantly more adverse outcomes than the use of one or two medications.
A great concern has been the general lack of regulatory approval of many of the medications for populations of pediatric patients. This is particularly ironic because most of the changes in legislation pertaining to pharmaceuticals have been the result of adverse events in infants and children. The 1938 Federal Food, Drug, and Cosmetic Act replaced the original Federal Food and Drugs Act of 1906 (Wiley Act) because nearly 100 individuals, mostly children, were poisoned by diethylene glycol (an antifreeze analog for vehicles) that had been added to an elixir of sulfanilamide. This new legislation prohibited the addition of poisonous substances (unless they were demonstrated to be safe in small concentrations) and instituted other measures to protect the consumer. The next major piece of legislation was the Kefauver-Harris Amendments, which were passed in 1962 after the thalidomide catastrophe. This legislation strengthened the safety standards by requiring the drug company to demonstrate effectiveness before marketing. The U.S. FDA then allowed drugs to be marketed to adults as “safe and effective,” but now the drug label was required to indicate that “safety and effectiveness had not been established in children” because no trials in children had been carried out. This had an enormous negative impact on drug development for children and led Shirkey to coin the now common expression “therapeutic orphans” when referring to drug development for children.
Until the late 1990s, nearly 80% of approved medications contained language within the drug label (package insert) that excluded children of varying ages; it should be noted that the legislation described later in the text has now resulted in some pediatric labeling in ~60% of marketed medications, which is an unequivocal victory for drug safety in children. The majority of the drugs used in the operating room (OR) and the intensive care unit (ICU) today have similar language. Common examples of disclaimers for drugs used in our daily practice include those for bupivacaine ( “Until further experience is gained in children younger than 12 years, administration of Sensorcaine [bupivacaine HCl] injection is not recommended” ) and for fentanyl ( “The safety of SUBLIMAZE in children younger than two years of age has not been established” ). Such disclaimers are placed in the package insert because the contents of the package insert must, by law, be based on “adequate, well controlled studies involving children.” Any use of a drug that is not specifically described in the package insert is considered “unapproved” or “off label.” The reason for the lack of labeling for children is that the appropriate controlled clinical trials were never supported by industry and the FDA did not have the legislative power to force the pharmaceutical companies to perform pediatric studies. In 1994, the FDA passed a new interpretation of the original Food, Drug, and Cosmetic Act that allowed manufacturers to review the published medical literature and submit these data to the FDA to support revised pediatric labeling. This led to additional changes in the drug label for 48 medications. Unfortunately, for drugs that were no longer under patent protection, there was no financial incentive to force the issue, so many drugs remained unlabeled for children despite many publications that outlined their safe use in children of all ages.
During the early stages of the AIDS epidemic, there was great pressure placed on the FDA to reduce the time for the drug approval process. New legislation was passed to raise funds to pay for additional consultants and experts to help the FDA with this process (The Prescription Drug User Fee Act [PDUFA]). This legislation was renewed in 1997, 2002, 2007, and 2012 and was redrafted for the sixth time (PDUFA VI) and signed into law in August 2017, thus providing “stable and consistent funding during fiscal years 2018–2022.” The PDUFA regulations have three components: (1) an application fee when a new drug or biologic is submitted to the FDA, (2) an annual product fee for nongeneric marketed drugs, and (3) an annual fee for each manufacturing site for nongeneric drugs. The goals of the new legislation are to further enhance scientific expertise and processes for regulatory decisions, improve patient perspectives in drug development, and provide longer stability of the PDUFA initiative. The monies from these fees greatly reduce the time from a New Drug Application (NDA) or Biologic License Application (BLA) to be marketed. The most recent iterations have expanded funding to support marketing safety and pharmacoepidemiology activities, as well as increased inspection of non–USA-based pharmaceutical manufacturing facilities. Approximately 72% of NDAs or BLAs were approved on the first application under PDUFA V compared with ~55% under PDUFA IV.
Additional changes at the FDA occurred in the late 1990s when the Food and Drug Administration Modernization Act and the Final Rule were passed. Tacked onto this legislation was the Better Pharmaceutical Act for Children, which granted 6 months of patent extension in exchange for pediatric studies of drugs that were still patent protected. This was later replaced with the Best Pharmaceutical Act for Children (BPCA) in 2002, which earmarked money for the National Institutes of Health (NIH) to support study of drugs no longer patent protected. This was subsequently challenged as giving excessive legal power to the FDA, but further legislation reinstituted the legal power to the FDA to now require drug companies to conduct research in children if the drug would have use in children (the Pediatric Research Equity Act). PDUFA IV was a much larger bill entitled the Food and Drug Administration Amendments Act of 2007. This bill renewed PDUFA IV, the Medical Device User Fee and Modernization Act, and BPCA. Of importance to researchers was the new requirement for registration of all clinical trials with an archive of thousands of trials that is easily searchable for clinicians as well as the public. Many journals now will not publish clinical pharmaceutical trials that have not been registered. Since the first legislation for children passed in 1998, there has been an explosion of pediatric drug trials (>1000 requested or carried out since 1997) and new drug labels have been created for 703 drugs; between 2005 and 2017 patent extension has been granted to at least 79 medications ( https://www.accessdata.fda.gov/scripts/sda/sdNavigation.cfm?sd=labelingdatabase ). Unfortunately, the money that was supposed to be earmarked to the NIH for generic drug trials has not been fully provided, so deficiencies in labeling for older drugs persist.
It is important for clinicians to appreciate that despite language on the label regarding use in children, they are perfectly within their medical and legal rights to use these drugs based on their judgment. “Unapproved use does not imply an improper use and certainly does not imply an illegal use. ” The use of a drug in a child is the decision of the individual physician and may be based on the available literature, despite the fact that formal FDA approval and labeling have not been achieved. The Committee on Drugs of the American Academy of Pediatrics is very clear on this issue: “Lack of approval for a specific use should not prevent physicians from prescribing an available drug in the best interest of their patients.”
The potent inhaled anesthetics are ether-based anesthetics with either a methyl ethyl (enflurane, isoflurane, and desflurane) or a methyl isopropyl (sevoflurane) polyhalogenated ether skeleton ( E-Table 7.1 ). The single exception in chemical structure is halothane, which is a polyhalogenated alkane. Of the methyl ethyl ether anesthetics, isoflurane and enflurane, are constitutional isomers. Desflurane differs from isoflurane in the single atomic substitution of a fluoride for a chlorine atom on the α-carbon of isoflurane. Sevoflurane differs from isoflurane in the substitution of a trifluoromethyl group for the chlorine atom, resulting in a methyl isopropyl structure. Although the general chemical structures of the four ether agents are similar, the single atomic substitutions confer substantially different physicochemical and pharmacologic properties described in later text and contrasted to the properties of halothane (see E-Table 7.1 ).
| Halothane | Enflurane | Isoflurane | Sevoflurane | Desflurane | Xenon | |
|---|---|---|---|---|---|---|
| Pharmacology | ||||||
| Chemical structure |

|
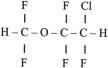
|

|
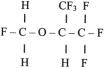
|
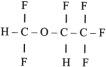
|
|
| Molecular weight | 197.4 | 184.5 | 184.5 | 200.1 | 168 | 131 |
| Boiling point (°C) | 50.2 | 56.5 | 48.5 | 58.6 | 23.5 | −108 |
| Vapor pressure (mm Hg) | 244 | 172 | 240 | 185 | 664 | |
| Saturation concentration (%) | 34 | 24 | 34 | 26 | 93 | |
| Odor | Mild, pleasant | Etheric | Etheric | Pleasant | Etheric | None |
| Solubility | ||||||
| λ b/g adults | 2.4 | 1.9 | 1.4 | 0.66 | 0.42 | 0.14 a |
| λ b/g neonates b | 2.14 | 1.78 | 1.19 | 0.66 | — | — |
| λ brain/b adults c | 1.9 | 1.3 | 1.6 | 1.7 | 1.2 | |
| λ brain/b neonates d | 1.5 | 0.9 | 1.3 | — | — | |
| λ fat/b adults | 51.1 | — | 45 | 48 | 27 | |
| MAC | ||||||
| MAC adults | 0.75 | 1.7 | 1.2 | 2.05 | 7.0 | 71 e |
| MAC neonates | 0.87 | — | 1.60 | 3.2 | 9.2 | |
a Data from Steward A, Allott PR, Cowles AL, Mapleson WW. Solubility coefficients for inhaled anaesthetics for water, oil and biological media. Br J Anaesth. 1973;45(3):282–293.
b Data from Lerman J, Gregory GA, Willis MM, Eger EI 2nd. Age and solubility of volatile anesthetics in blood. Anesthesiology 1984;61(6):139–143; Malviya S, Lerman J. The blood/gas solubilities of sevoflurane, isoflurane, halothane, and serum constituent concentrations in neonates and adults. Anesthesiology 1990;72(5):793–796.
c Data from Yasuda N, Targ AG, Eger EI 2nd. Solubility of I-653, sevoflurane, isoflurane, and halothane in human tissues. Anesth Analg. 1989;69(3):370–373.
d Data from Lerman J, Schmitt-Bantel BI, Gregory GA, Willis MM, Eger EI 2nd. Effect of age on the solubility of volatile anesthetics in human tissues. Anesthesiology 1986;65(3):307-311.
e From de Jong RH, Eger EI 2nd. MAC expanded: AD50 and AD95 values of common inhalation anesthetics in man. Anesthesiology 1975;42(4):384–389.
In comparison to the potent inhaled anesthetics, nitrous oxide and xenon exist in gaseous form under atmospheric conditions. Nitrous oxide is a by-product of chemical processes, whereas xenon is a naturally occurring element (0.05 ppm in the atmosphere), produced by fractional distillation of atmospheric gas. Environmentally, nitrous oxide depletes the ozone layer, whereas xenon is environmentally inert. There is a wealth of data on the pharmacology of nitrous oxide in humans but far less on xenon in adults and none, to date, in children.
The rate of increase or equilibration of the partial pressures of alveolar to inspired anesthetic (also known as the wash-in) is a function of the rate of delivery of anesthetic to and uptake from the lungs. Six factors determine the wash-in of inhaled anesthetics ( Table 7.3 ) : the first three determine the delivery of anesthetics to the lungs, and the second three determine their rate of removal (uptake) from the lungs. The wash-in, defined as the ratio of the alveolar to inspired anesthetic partial pressures (F a /F i , or fractional alveolar to fractional inspired partial pressures), increases from zero to a value of unity (1), when the inspired and alveolar partial pressures have equilibrated ( Fig. 7.14 ). Although not shown in the figure, the wash-in of xenon should be the most rapid of all inhaled anesthetics based on its physicochemical properties (see E-Table 7.1 ). For the F a /F i to increase toward equilibration, the rate of delivery of anesthetic to the lungs must substantially exceed its uptake from the lungs.
|
 of N 2 O, desflurane, sevoflurane, isoflurane, and halothane in adults. The order of wash-in (N 2 O > desflurane > sevoflurane > isoflurane > halothane) is inversely related to their solubilities in blood. F a , fractional alveolar partial pressure of anesthetic; F i , fractional inspired partial pressure of anesthetic; N 2 O, nitrous oxide; SD , standard deviation.")
The rates of increase of F a /F i of halothane (as well as isoflurane, enflurane, and nitrous oxide) in infants and children are more rapid than those in adults ( Fig. 7.15 ). The more rapid rate of increase of F a /F i in neonates compared with adults has been attributed to four factors ( Table 7.4 ); the order in the table reflects their relative contributions to the rapid wash-in. Based on these factors and their physical chemical properties, we speculate that the wash-in of sevoflurane and desflurane in neonates and infants will be comparable to those in adults. This amounts to a safety factor for the latter anesthetics that was not previously afforded with halothane.
 of halothane in children and adults.")
| Greater ratio of alveolar ventilation to functional residual capacity Greater fraction of the cardiac output distributed to the vessel-rich group Reduced tissue/blood solubility Reduced blood/gas solubility |
The effect of the inspired concentration on the F a /F i of anesthetics relates only to those that are administered in large concentrations (i.e., nitrous oxide). The greater the F i of nitrous oxide, the more rapid the increase of F a /F i . This effect, known as the concentration effect (second gas effect), depends on both a concentrating effect and an increase in alveolar ventilation that results from an increased uptake of nitrous oxide. Hence, agents that depend on alveolar ventilation for their wash-in (i.e., the more soluble anesthetics) will have a more rapid wash-in when administered with nitrous oxide. This effect diminishes as the solubility of the anesthetic decreases and as time passes.
The ratio of alveolar ventilation (Va) to functional residual capacity (FRC), Va/FRC, is the primary determinant of the rate of the delivery of inhaled anesthetics to the lungs. The greater the Va/FRC ratio, the more rapid the F a /F i ( E-Fig. 7.5 ). However, the ratio does not affect all anesthetics similarly: Va/FRC affects more soluble anesthetics (e.g., halothane) to a greater extent than less soluble anesthetics (i.e., sevoflurane and desflurane). In the case of soluble anesthetics (e.g., halothane), their increase in F a /F i depends substantively on a large Va/FRC ratio since their uptake from the lungs is great (because of their solubilities), and this limits the rate of increase in F a /F i . Changes in the Va/FRC directly affect the F a /F i of anesthetics in proportion to their blood solubilities.
 of more soluble (i.e., halothane) and less soluble (i.e., N 2 O) anesthetics. Changes in ventilation speed the wash-in of more soluble anesthetics to a greater extent than do changes in ventilation for less soluble anesthetics. F a , fractional alveolar partial pressure of anesthetic; F i , fractional inspired partial pressure of anesthetic; N 2 O, nitrous oxide.")
In terms of age-related effects of F a /F i , the Va/FRC ratio accounts for most of the differences between the F a /F i of anesthetics in neonates and adults (see Table 7.4 ). The Va/FRC ratio is approximately 5 : 1 in neonates compared with only 1.5 : 1 in adults. The greater Va/FRC ratio in neonates may be attributed to the 3-fold greater metabolic rate and, therefore, 3-fold greater Va/FRC in neonates compared with adults. This is true for both spontaneous and controlled ventilation, depending on the settings used during controlled ventilation.
Become a Clinical Tree membership for Full access and enjoy Unlimited articles
If you are a member. Log in here